Category: Statistics

  • 2026 Roblox Statistics That Prove How Successful This Platform Has Become

    2026 Roblox Statistics That Prove How Successful This Platform Has Become

    Long before Little Big Planet allowed players to create and post their own levels for other players to rate, Roblox was a game ahead of its time. It wasn’t as big as LBP, but Roblox eventually turned into one of the biggest multiplayer social platform on the Internet.

    Roblox Wallpaper Roblox Statistics

    The game allowed players to create their own games or products, and it allowed for the growth of a community of developers who shared their homebrewed games using the engine and other assets provided for by Roblox.

    Other players could play these homebrew games and give feedback to the developers when possible. Eventually, Roblox allowed developers to earn from their own games through the platform’s microtransactions. The game has its own currency called Robux and players could purchase said currency for real money.

    Today, we’re going to look at some interesting Roblox statistics, from revenue to average Roblox users, and see why this platform has become one of the biggest online gaming platforms on the Internet right now.

    Roblox Overview

    Roblox was founded back in 2004 by Eric Cassel and David Baszucki, and was released for PC in 2006. The game had a certain charm to it thanks to its funky physics and graphics. But its biggest appeal was allowing players to express their creativity by letting them develop their own Roblox games within the platform.

    As the company and platform grew, more features were added over time, including the in-game currency, safe chat filter, and cross-compatibility amongst devices to name a few. Roblox surged in popularity by 2010 and even more so during the onset of the Covid-19 pandemic.

    Roblox Key Statistics

    • Roblox is currently valued at $27.3 billion in 2022 [1], [2].
    • In 2020, they generated $924 million [4], [7].
    • Roblox generated more than $1.9 billion in revenue in 2021 [1], [3].
    • For Q1 2022, Roblox already earned $537 million in revenue [6]
    • Google Play users have made it possible for Roblox to become one of the top 10 highest grossing Apps in the Google Play Store. Google Play users have generated more than $9.14 million for June 2022 [8].
    • Roblox monthly active users reached 202 million [11].
    • Out of these 202 million monthly active users, 43 million are daily active users [11].
    • Roblox is comprised of younger users. 67% of their daily active users are aged 16 years old and below.
    • Adopt Me! is the gaming platform’s most popular game in terms of visits. The game has almost 29 billion visits from different Roblox users total [15].
    • 79% of Roblox daily active users log in through the game using their mobile devices or smartphones.

    Roblox Revenue

    • Roblox is currently valued at over $38 billion, and is one of the most valuable gaming companies in the world [1] ,[9].
    • Roblox’s valuation went from $1.1 billion in 2017 to $27.38B in 2022 (currently) [1],[2]
    • Roblox generated $1.9 billion in revenue just in 2021 [1], [3].

    How Much Money Did Roblox Make?

    • Roblox earned $924 million in revenue back in 2020 [4], [7].
    • 57%, or six out of ten, Roblox app users who purchased from the gaming platform during the first three quarters of 2021 spent an hour or less on average using the platform. 24% of Roblox iOS users who made in app purchases spent an average of 1 and 5 hours playing during the period of observation [5].
    • During Q1 of 2022, Roblox generated $537 million in revenue, which was down from $568.8 million in revenue from the previous quarter [6].
    • Roblox is one of the top 10 leading Android Apps based on revenue in the Google Play Store worldwide as of June 2022. Roblox generated $9.14 million in revenue just from Android users for that time period [8].
    • In November 2021, Roblox Corporation ranked first amongst the biggest gaming companies in terms of market cap, sitting at $74.55 billion. Further activity and hype from the Metaverse fueled the market activity [9].
    • The company’s market cap decreased to $18.95 billion after pulling out of the Chinese market in December 2021 [9].
    • In October 2021, Roblox was the highest grossing gaming app in the United States for iPhones with more than $3 million in daily revenue coming from the millions of daily active users. Candy Crush Saga and Coin Master followed with less than $2 million in daily revenue [10].
    • Roblox was the highest grossing iPad app in the Apple App Store in the USA in terms of revenue. The game earned $37 million from iOS users through iPad. Candy Crush Saga came in second place with $19.6 million revenue [13].

    Roblox Users Statistics

    With the revenue that Roblox is generating on a monthly basis, we’re going to take a look at just how many users there are on this platform, whether they’re Roblox players or Roblox developers.

    How Many People Play Roblox?

    Adopt Me Roblox Statistics
    • Roblox has 202 million monthly active users [11].
    • Out of the 202 million active users, 43 million are Roblox daily active users, or people who play Roblox daily [11].
    • There are more than 9.5 million developers right now on Roblox. These are the people who create content for other people playing Roblox [11].
    • 67% of Roblox players are aged 16 years old and younger [11].
    • 51% of Roblox users are male, and 44% are female [11].
    • Majority of Roblox daily active users are located in Canada and in the USA, despite being available in 22 countries [11].
    • Roblox has accumulated more than 73.1 billion hours of gaming since 2018 [12].
    • Kids under the age of 13 spent a total of 51.5 million hours on the Roblox platform [12].
    • Total time spent on the platform for Q2 of 2021 reached 9.73 billion hours [12].
    • The Bloxy Awards is Roblox’s very own awards ceremony. In 2021, the awards ceremony generated more than 26 million visits with 855,000 players connected simultaneously [14].
      • In 2020, The Bloxy Awards raised $100,000 for charity [14].
    • Adopt Me! is one of the most popular games in the platform [1], [15]. In terms of visits, Adopt Me! has about 28.6 billion from users. Visits are counted when a player has spent more than 30 seconds, which is one of many Roblox user sessions being considered [15].

    How Many People Downloaded Roblox?

    • Roblox has been downloaded 383 million times across mobile devices using Google Play and Apple App Store [16].
    • More than 25 million reviews have been left by Roblox’s daily active users on the Google Play Store, while only 6.3 million reviews are found on Apple App store [16].
    • More than 79% of Roblox’s daily active users access the platform using their mobile devices [17].
    • 25% of Roblox users access the game through the desktop [17].

    Roblox And Their Controversies

    Setting aside the Roblox statistics and the revenue they generated, both the game and company were not without their controversies. These controversies led to the company developing certain features to protect the million daily active users that are logging on.

    Some of the most notorious controversies to plague the game developers and the platform itself included:

    • An 11-year old girl was found to have spent more than $6,000 on Roblox. The company was criticized for making it easy for kids to purchase in game products using their parents’ money [17].
    • The game turned into a playground for right wing and fascist groups [18], on top of being avenues for sexual harassment and activities.
    • Online gaming is not without its profanities, and the company was called out for their AI’s inability to properly filter out offensive language [19].

    Wrapping It Up!

    So what’s next for Roblox developers and the company itself? It’s safe to assume that Roblox is constantly working on improving the functionality and safety of their platform. After all, young children comprise more than a couple million daily active users for the platform.

    Every feature, from the chat filters to the microtransaction system, is always under a microscope. But despite trolls and vandals proliferating the game, Roblox boasts of being one of the safest online communities around for the younger gaming audience.

    References

    [1] https://www.businessofapps.com/data/roblox-statistics/

    [2] https://www.macrotrends.net/stocks/charts/RBLX/roblox/net-worth

    [3] https://www.wsj.com/articles/roblox-raises-150-million-in-funding-in-bet-on-metaverse-11582754400

    [4] https://pitchbook.com/news/articles/roblox-gaming-direct-listing-valuation

    [5] https://www.statista.com/statistics/1292697/us-ios-roblox-iap-purchasers-by-time-spent/

    [6] https://www.statista.com/statistics/1190638/quarterly-revenue-roblox-corporation/

    [7] https://www.statista.com/statistics/1189990/annual-revenue-roblox-corporation/

    [8] https://www.statista.com/statistics/271674/top-apps-in-google-play-by-revenue/

    [9] https://www.statista.com/statistics/1197213/market-value-of-the-largest-gaming-companies-worldwide/

    [10] https://www.statista.com/statistics/263988/top-grossing-mobile-ios-gaming-apps-ranked-by-daily-revenue/

    [11] https://backlinko.com/roblox-users

    [12] https://blog.roblox.com/2018/03/roblox-emerges-top-online-entertainment-platform/

    [13] https://www.statista.com/statistics/690847/us-top-ipad-apps-by-revenue/

    [14] https://blog.roblox.com/2021/03/8th-annual-bloxy-awards-complete-winners-list/

    [15] https://roblox.fandom.com/wiki/List_of_places_with_the_most_visits

    [16] https://www.gamesindustry.biz/roblox-player-spending-passes-usd1-5bn-on-mobile

    [17] https://www.techspot.com/news/85882-eleven-year-old-girl-spends-almost-6000-roblox.html

    [18] https://www.wired.com/story/roblox-online-games-irl-fascism-roman-empire/

    [19] https://web.archive.org/web/20210101115812/https://www.foxbusiness.com/technology/roblox-discord-teen-gamers-inappropriate
  • 2026 Candy Crush Statistics For The Avid Fan

    2026 Candy Crush Statistics For The Avid Fan

    Who would’ve thought that Candy Crush would turn from a browser game into one of the most played mobile games in history.

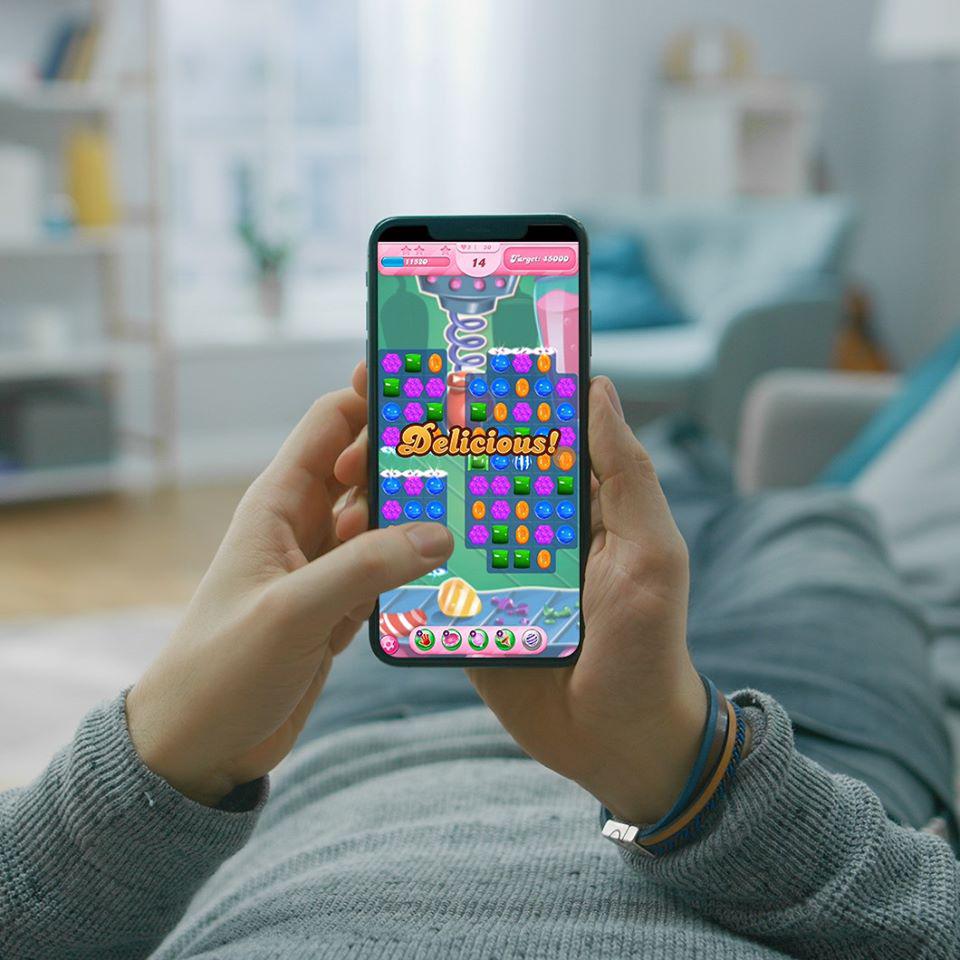
    Candy Crush Saga Screenshot Candy Crush Statistics

    Developed by King, Candy Crush started out as a browser game on Facebook back in April 2012. The premise of the game was simple. You were given a puzzle where you needed to identify and match three elements on the grid in order to remove them and get new elements after.

    Matching more than three elements will give you more power-ups and clear up the grid faster. As you progress through the game, you’ll encounter maps with different goals and requirements. There’s also a time limit so it’s going to be difficult for you the more levels you go through. This in turn requires you to think ahead and strategize your moves for any particular grid before moving on to the next one.

    The game has been around for almost ten years now and is consistent in keeping itself up to date. In this article, we’ll explore different candy crush statistics and go through the numbers to answer questions such as how much they’ve made over the years and how many users they have as of this writing.

    Key Candy Crush Statistics

    • How many people play Candy Crush? Candy Crush Saga has over 273 million monthly active users.
    • Candy Crush was the first F2P or Freemium game to generate $1 billion in revenue [1].
    • Candy Crush only earned $77 million a year after its release. They earned $1.13 billion two years later [1].
    • Activision Blizzard acquired King, the developer of Candy Crush and other titles, for $5.9 billion in 2016 [1].
    • Candy Crush Saga revenue for Q3 of 2021 was $652 million and was considered the highest earning title under the Activision flag [1].
    • Candy Crush Saga had more than 2.7 billion downloads accumulated as of 2017 [1].
    • 50% of the Candy Crush players are aged between 20 and 40 years old [4].
    • There are currently 11,690 levels installed in the game as of May 2022. Each Wednesday, they add anywhere between 30 and 90 levels. Players can also participate in polls that let devs know how many levels should be added for the next patch [7].
    • The game is played by people all over the world, spanning 6 continents [7].
    • 38 minutes a day is the average time Candy Crush Saga players spend playing the game [4].

    Candy Crush Revenue Statistics

    • Candy Crush was the first F2P game to earn over $1 billion in revenue back in 2014 [1].
    • A year after the release, the game only made $77 million. In two years, they earned $1.13 billion [1].
    • In 2020, the game earned $1.19 billion and was one of the highest grossing mobile games for that year [1].
    • King was acquired by Activision Blizzard back in 2016 for $5.9 billion. In Q3 of 2021, King generated $652 million in revenue for Activision Blizzard and was considered the highest earning title under the Activision brand.
    • Candy Crush Saga earned $556.4 million in revenue from in app purchases in 2021, making it the highest earning Candy Crush title for that year. Candy Crush Soda Saga comes in second place with $196.3 million in IAP revenue and Candy Crush Friends Saga with $28.29 million in IAP revenue for that year [2].

    Candy Crush Download Statistics

    • As of 2017, Candy Crush Saga generated 2.7 billion downloads [1].
    • In 2021, Candy Crush Saga accumulated 119 million downloads and is one of the top 10 leading mobile game apps worldwide by downloads [3].

    How Many People Play Candy Crush?

    Person Playing Candy Crush Candy Crush Statistics

    Candy Crush User Statistics

    • Candy Crush Saga’s core market is women aged 35 years and older [4].
    • 50% of the people who play Candy Crush Saga are aged between 20 and 40 years old [4].
    • The average age of people who play Candy Crush games is 30 years old [4].
    • Candy Crush Saga Players distribution by gender is 54% female and 46% male [4].
    • Candy Crush Saga reported 273 million monthly active users for 2020 [1].
    • Players spent an average of 38 minutes per day playing the game in 2019 [1].
    • 16.7 % of people who downloaded Candy Crush Sage prefer casual games, while 9.8% lean more towards puzzle games [5].

    Other Impressive Candy Crush Saga Usage Statistics

    • People playing Candy Crush Saga from the United States played the most number of rounds at 212 billion Candy Crush levels played in March 2018. Players from Great Britain followed with 50 billion levels played and Spain with 40 billion levels[5].
    • The game is currently popular in 196 countries. That’s the equivalent of saying there are people playing Candy Crush games from 6 continents out of 7.7 [5].
    • The highest score recorded was 1,999,259,792 and this was in 2018 [6].
    • As of May 2022, there are currently 11,690 levels available for Candy Crush players from Google Play, Apple App Store, and Facebook versions. King’s official forums also keeps track of the current number of levels [7].
    • Every Wednesday, between 30 and 60 levels are added to the game. The forums also has polls that allows Candy Crush players to dictate how many levels should be added per week for the next updates [7].

    Wrapping It Up

    Candy Crush Saga is probably one of the most addictive mobile games in the mobile games market right now. The game is simple and it’s easy to understand the mechanics of the different games under its franchise. It doesn’t come off as a surprise that something as simple as this game could end up becoming one of the highest grossing games in the mobile game market.

    The premise of matching and destroying candies to move on to the next level might be underwhelming for the elite mobile gamers, but for the casual gamers, this game is heaven sent. Candy Crush Saga, and any other game under their umbrella, could keep you entertained for hours just by matching candy pieces. Whether you’re killing time in a waiting room, coffee shop, or classroom, Candy Crush Saga is the perfect mobile gaming partner.

    References

    [1] https://www.businessofapps.com/data/candy-crush-statistics/#:~:text=While%20Candy%20Crush%20is%20not,the%20game%20for%20returning%20players.

    [2] https://www.statista.com/statistics/954681/candy-crush-mobile-revenue/

    [3] https://www.statista.com/statistics/1285134/top-downloaded-gaming-apps-worldwide/

    [4] https://www.theguardian.com/technology/2014/may/11/candy-crush-saga-games

    [5] https://www.similarweb.com/app/google-play/com.king.candycrushsaga/statistics/

    [6] https://www.dailymail.co.uk/femail/article-5518933/Candy-Crush-Saga-statistics-total-games-played-highest-score.html

    [7] https://www.pocketgamer.com/candy-crush-saga/how-many-levels-are-there/

  • 2026 Android Statistics That Will Blow Your Mind!

    2026 Android Statistics That Will Blow Your Mind!

    Android is one of the two most popular mobile OS (operating systems) in the world, with a couple of billion active users across 190+ different countries.

    Android User With A Phone Android Statistics

    The Android operating system was developed by Andy Rubin as an alternative to Palm OS and iPhone. It became an instant favorite amongst smartphone users and for mobile phone manufacturers in 2010. With global titans such as Samsung and LG running all their phones on Android, it didn’t take long before it became the most popular mobile OS.

    It was so popular that they reached 1 billion active users around the world back in 2014. As the operating system grew, so did Google’s control over it too. While manufacturer partners customized the platform as they saw fit, Google slowly added compulsory features and services that ensured they always had the advantage through their suite of apps.

    Android remains as one of the most dominant mobile phone operating system in the world right now, even surpassing Apple in the United States and Japan.

    But what are the numbers right now and what are Android statistics telling us about the entirety of its users, market share, and more?

    We’ll find out in this article.

    Key Android Statistics

    • 1.43 billion smartphones were sold globally in 2021. 24% of smartphones sold were Apple products [1], [2].
    • Smartphone penetration in 2020 hit 78.05% and is expected that 87% of mobile phone users will own a smartphone [3], [4].
    • Smartphone sales in the USA was projected to reach $73 billion in 2021 [5].
    • Google Android and Microsoft Windows are the biggest operating systems for smartphone and desktop/laptop with 2 billion users and 1.6 billion users respectively [12].
    • There’s about an estimated 4 billion Internet users around the world [12].
    • In the USA, 133 million people use an Android smartphone or Android mobile phone [13].
    • Google Play Store recorded 111.3 billion downloads in 2021 in contrast with iOS only having 32.3 billion. 55 billion downloads were gaming apps [15].
    • Users between the ages of 18 and 24 years old spent 112.6 hours a month on average on Android apps [15].
    • 95% of Android users are aged between 18 years old and 49 years old [16].

    Android Revenue Statistics

    • Smartphone vendors sold a total of 1.43 billion smartphones globally in 2021. In the 4th quarter of that year, around 24% of smartphones sold were Apple mobile phones [1], [2].
    • Smartphone penetration around the world has reached 78.05% in 2020. It’s predicted that 87% of all mobile phone users will own a smartphone, which is a 27% increase from that of 2010[3], [4].
    • Sales of smartphones in the USA were projected around $73 billion in 2021, compared to $18 billion in 2010 [5].
    • Global sales of smartphones is predicted to increase in every major region
    • Android phones sold worldwide had an average selling price (ASP) of $261 in 2020, which was a 4.5% increase from 2019 [6].
    • As of April 2021, the 10.0 Android Operating System had a 19.49% share amongst all tablet Android devices globally. The 9.0 Pie version follows with 13.26% of the Android tablet market [7].
    • As of January 2022, the Android mobile OS 11.0 had a share of 38% amongst all Android mobile devices globally. The older 10.0 version follows with 26% and the even older Pie 9.0 in third place with 12.48% for that period of observance [8].
    • There are 2.65 million apps right now in the Google Play Store as of June 2022 [9].
    • Mobile gaming apps is the most downloaded Android category globally. Dessert DIY is the most downloaded app in the Google Play Store worldwide as of June 22. Dessert DIY generated 22 million downloads from Android Users, followed by Bucket Crusher with 21.5 million downloads [10].
    • 97% of mobile apps in the Google Play Store are available for free, and only 3% of apps require payment of any kind [11].

    How Many Android Users Are There?

    • Microsoft Windows and Google Android are the two operating systems with the most number of users (1.6 billion and 2 billion users respectively). To date, there are more than 4 billion internet users around the world [12].
    • There are 133 million Android users in the USA alone. The numbers were also surprising as it was only 87 million back in 2014 and now at 133.4 million in 2022 [13].
    • For age groups, Android is the most popular mobile OS amongst people between the ages of 50 and 64 years old with an 83% market share [14].

    Android Usage Stats

    • Close to 111.3 billion downloads were recorded from the Google Play Store by the end of 2021 while iOS only had 32.3 billion. 55 billion of those downloads were games [15].
    • Users between the ages of 18 and 24 years old spent an average of 112.6 hours a month on apps, followed by users from the 25 to 34 age group with 102.4 hours [15].
    • 95% of Android users belong are aged between 18 years and 49 years old [16].

    Android Market Share

    • Samsung is the largest smartphone manufacturer in the world. It’s predicted recently that the brand will ship out 276 million units by the end of 2022. Last year and in 2020, they had 263 million and 267 million units shipped out respectively [17].
    • Apple is the second largest smartphone manufacturer and is predicted to ship out 243 million units globally by the end of 2022. In third place is Xiaomi with 220 million devices shipped out [17].

    Android vs Apple Market Share

    • Android was the leading mobile OS in January 2022 and retained a 70% market share while iOS only accounted for 25% of the mobile device market share globally. As of February 2022, Android still held 70.97% market share and iOS had 28.27% [18].
    • Smartphones running Android OS accounted for 87% of the global market in 2019 and is projected to increase within the next few years. Apple’s iOS only retained 13% market share for that year of observation [19].
    • Smartphone sales worldwide have peaked to 1.55 billion units in 2018, but gradually declined up to 2021 with 1.433 billion units [20].
    • The costs of buying a new cellphone also decreased to $215 [21].
    • Android sales are declining in China, while Europe, USA, and Japan continue to be the dominant markets for Android devices [22].

    The decline of sales of Android devices and Android users in China can be attributed to the government’s move to ban most Google Apps because they don’t work within the country. Chinese mobile phone users are now going for local brands such as Oppo, Xiaomi, and LeEco to name a few.

    China also banned other apps such as Facebook, Twitter, and YouTube as the government doesn’t want any of the foreign tech companies to spy on their citizens. There are Chinese alternatives to the apps that the Chinese government has banned.

    Wrap Up

    The numbers are telling us that Android phones are here to stay, and that this mobile operating system is going to dominate the mobile phone market within the next few years. It might even be safe to assume that Android phones will be everywhere and that the number of users for Apple iOS will gradually decrease within the global market.

    We might even be looking at a 95-5 split in the global market share between Android version market share and the Apple iOS.

    Reference

    [1] https://www.statista.com/statistics/263437/global-smartphone-sales-to-end-users-since-2007/

    [2] https://www.statista.com/statistics/757441/worldwide-htc-smartphone-unit-shipments/

    [3] https://www.statista.com/statistics/203734/global-smartphone-penetration-per-capita-since-2005/

    [4] https://www.statista.com/statistics/201184/percentage-of-mobile-phone-users-who-use-a-smartphone-in-the-us/

    [5] https://www.statista.com/statistics/191985/sales-of-smartphones-in-the-us-since-2005/

    [6] https://www.statista.com/statistics/951537/worldwide-average-selling-price-android-smartphones/

    [7] https://www.statista.com/statistics/1118899/tablet-android-version-share-worldwide/

    [8] https://www.statista.com/statistics/921152/mobile-android-version-share-worldwide/

    [9] https://www.statista.com/statistics/266210/number-of-available-applications-in-the-google-play-store/

    [10] https://www.statista.com/statistics/693944/leading-android-apps-worldwide-by-downloads/

    [11] https://www.statista.com/statistics/266211/distribution-of-free-and-paid-android-apps/

    [12] https://www.statista.com/statistics/543185/worldwide-internet-connected-operating-system-population/

    [13] https://www.statista.com/statistics/232786/forecast-of-andrioid-users-in-the-us/#:~:text=The%20number%20of%20Android%20smartphone,than%20130%20million%20in%202021

    [14] https://www.statista.com/statistics/489255/percentage-of-us-smartphone-owners-by-age-group/

    [15] https://www.businessofapps.com/data/app-statistics/

    [16] https://earthweb.com/how-many-people-use-android/

    [17] https://www.oberlo.com/blog/mobile-usage-statistics

    [18] https://www.statista.com/statistics/272698/global-market-share-held-by-mobile-operating-systems-since-2009/

    [19] https://www.statista.com/statistics/272307/market-share-forecast-for-smartphone-operating-systems/

    [20] https://www.statista.com/statistics/263437/global-smartphone-sales-to-end-users-since-2007

    [21] https://www.statista.com/statistics/484583/global-average-selling-price-smartphones/

    [22] https://www.counterpointresearch.com/china-smartphone-share/

  • 2026 Minecraft Statistics (Accurate Revenue and User Stats)

    2026 Minecraft Statistics (Accurate Revenue and User Stats)

    Key Minecraft Statistics

    • Microsoft acquired Minecraft for $2.5 billion.
    • Minecraft player count is above 600 million. 400 million of them are coming from China [4].
    • Minecraft’s lifetime revenue from game sales alone, excluding IAP, has already reached $3 billion [1].
    • Minecraft generated $415 million in revenue in 2020, while Minecraft Mobile generated $146.2 million for the same year [1].
    • Mojang earned $500 million from Minecraft in 2018 and $375 million in 2019 [1].
    • Minecraft Mobile, or The Bedrock Edition, earned $110 million in revenue from mobile sales [1].
    • It only took six days for Mojang to develop Minecraft in 2009. The game was launched in 2011 [1].
    • The United States accounts for 37.2% of servers worldwide [10].

    You’ve probably seen a YouTube video or two about a game that lets people build whatever they want, and no, we’re not talking about Sims. This game we’re talking about looks like it came from the early 2000’s era of video games because of its blocky textures and graphics. The game that we’re referring to is Minecraft.

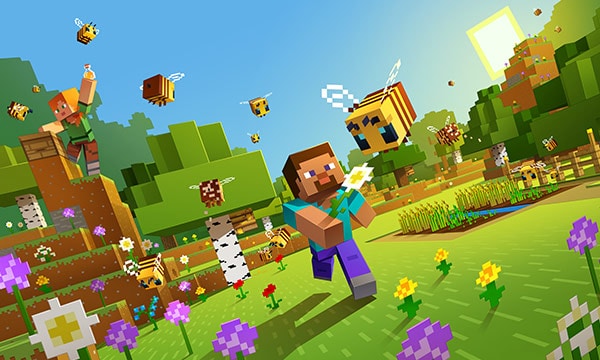
    Minecraft Featured Image Minecraft Statistics

    Minecraft was released in November 2011 by a company called Mojang Studios, a game development company located in Stockholm, Sweden. The premise of the game is simple. It’s a sandbox game that allows you to interact with the world around you and build whatever out of the materials you farm and gather.

    But like Sims, Minecraft doesn’t really give you all the info that you need on what you need to do, or what the goals are. You’re just there to let your creativity do the rest. For those less creative, we have built out some of the best Minecraft house ideas. Minecraft throws you in a massive 3D world with lots of resources to farm, gather, and extract. And after gathering these items, you can CRAFT the necessary items to build houses, raise animals, and even defend yourself.

    For people who play Minecraft, the appeal is undeniable but what about those who aren’t familiar with the game or who only saw the game through Minecraft YouTube videos? The latter are probably confused as to why this game has become so huge. Lego already has box sets of the franchise, Netflix has a Minecraft show, and there are clothing brands out there with Minecraft designs.

    We’re going to take a look at the numbers and the overall Minecraft statistics and see why this game has become one of the most successful ones in the video game industry.

    An Overview of Minecraft

    Minecraft Gameplay Minecraft Statistics

    Minecraft was developed by Mojang Studios, located in Stockholm, Sweden. The game was created only in six days in 2009 and launched two years after in 2011. Seeing the success of the game, Microsoft bought Minecraft for $2.5 billion in 2014.

    The game has won multiple awards including Kid’s Choice Award for Video Games in 2015, Best Independent Game Award in 2011, and Best Family and Social Game Award in 2015. The game’s creator, Markus Persson, won the BAFTA Games Special Award in 2012. .

    How Much Money Does Minecraft Make?

    Minecraft Character Minecraft Statistics

    Minecraft Revenue Statistics

    Here are the numbers that let us know how much revenue Minecraft has generated over the years [1]:

    • Minecraft’s lifetime revenue already reached $3 billion, just from selling the game and excluding in game transactions.
    • In 2020, Minecraft generated $415 million in revenue and $146.2 million in revenue was generated from mobile devices.
    • Mojang earned $500 million from Minecraft in 2018 and $375 million in 2019.
    • Minecraft’s mobile version , The Pocket Edition (now known as Bedrock Edition), generated $110 million in revenue from mobile devices in 2018.
      • The USA was the biggest spender for the same period of observance, accounting for 48% of the entire revenue. Great Britain followed at 6.6% and Japan with 5%.
    • Creators have earned $350 million from the Minecraft Marketplace [2].
      • Content creators receive 50% of the profit, meaning the developers have earned at least $17 million from them.
      • 12,000 content creators are active right now on the Minecraft Marketplace.
      • The program started in 2017 with only 9 Minecraft Marketplace creators, and 3 more were added three months later.
      • 67% of players are purchasing products sold on the Minecraft Marketplace.
    • The mobile version of Minecraft generated $160.7 million in revenue from global IAP or in app purchases in 2021, which was a 12.68% increase from the previous year [11].
    • Mojang announced on May 2020 that Minecraft games sales have reached 200 million worldwide [11].
    • Minecraft’s largest prize pool for a tournament reached $100,000. The tournament was called the Dream Vs Technoblade Minecraft Tournament, organized by the one and only MrBeast [3].

    Technoblade is one of the most popular content creator for the game. He streamed Minecraft on Twitch and also created Minecraft YouTube Videos up until his passing in June 30, 2022 [4]. The community of Minecraft players as a whole is wholesome and constantly hosts different events.

    One such notable organizer of Minecraft tournaments and events is MrBeast, the YouTube philanthropist. MrBeast is well known for having the deepest pockets and doesn’t shy away from holding events and tournaments with large cash prizes straight out of his own pockets.

    How Many Minecraft Players Are There?

    • There are more than 600 million registered players in Minecraft worldwide. 400 million of these users are from China [4].
      • This roughly means that 1 out of every 4 people in China play Minecraft.
      • In 2020, China added 100 million new users and setting a new growth record for Minecraft.
    • The average age of Minecraft Players is 24 years old [5].
      • Young boys aged 3 years to 12 years old comprise 54% of the group playing Minecraft compared to 32% for girls within the same age.
      • Within the age bracket of 6 years old to 8 years old, 68% of them are male and 29% are female.
    • Minecraft is suitable for kids aged 7 and up.
    • Minecraft’s monthly active users is 141 million in 2021, while it was only 131 million in 2020. In 2019, that number was 91 million [8].
    • Minecraft’s multiplayer mode clocked in over 1 billion hours logged in by all players globally [8].
    • At the onset of the Covid-19 pandemic in 2020, Minecraft experienced a 25% increase in number of active users and 40% increase in number of multiplayer sessions [8].
    • United Stats accounts for 21% of the total number of active players, followed by Brazil with 6.17% and Russia with 5.59% [9].
    • As of this writing, there are currently 3.6 million players logged in to the game.
    • Majority of servers (37.2%) are from the United States. There are 1,693 servers in the country alone. Great Britain comprises 23.4% of the total server count with 1,065 servers, and Germany with 453 servers (9.9%) [10].
    • In August 2021, the number of monthly active users hit 141 million globally. In May 2020, that number was 126 million [12].
    • Minecraft videos and Twitch streams were viewed by 38,500 viewers in April 2022 [13].

    Minecraft events on the video streaming service Twitch were watched by an average of 38.5 thousand viewers in April 2022

    How Many People Have Downloaded Minecraft?

    • Minecraft ranks #41 in Top Grossing Games on iPhone and #19 for the same category on iPad [14].
    • Google Play US ranks Minecraft as the Top Paid Game and Top Paid App, and Top Paid Game (arcade category) [15].
    • Minecraft launched a Chinese Edition together with NetEase. Minecraft Chinese Edition has been downloaded 425 million times as of July 2021 [16], [17].
    • In 2017, the year it was launched, Minecraft Chinese Edition only had 75 million downloads [16], [17], [18].

    Minecraft launched its Chinese edition with NetEase, and it has been downloaded 425 million times as of July 2021.

    Wrapping Up

    What is the true value of Minecraft, Minecraft Mobile, Minecraft Dungeons, and all the other components of the franchise? People still play Minecraft to this day, and the Minecraft Player Count on a daily basis is in millions. The hundred million monthly active users implies that the game is one of the popular video games out there, and is constantly enjoyed by even the top Twitch and YouTube content creators.

    The gaming community itself is wholesome, even though there are a few bad eggs here and there.

    Minecraft is one of the best selling video games of all time, and all because this video game allowed you to exercise your creativity and earn money too. The social aspect of Minecraft is also very well integrated through the mini maps, dungeons, and other player-created maps. When people play Minecraft, it’s a challenge for them to determine whether or not the server they’re on is official or hosted by other players.

    References

    [1] https://www.theverge.com/2020/5/18/21262045/minecraft-sales-monthly-players-statistics-youtube

    [2] https://www.windowscentral.com/minecraft-live-2021-numbers-update

    [3] https://www.esportsearnings.com/games/559-minecraft

    [4] https://www.tweaktown.com/news/76446/minecraft-has-400m-players-in-china-alone-600m-globally/index.html

    [5] https://www.pcmag.com/news/minecraft-has-surpassed-131-million-monthly-active-users

    [6] https://www.eurogamer.net/articles/2019-09-16-minecraft-has-acquired-another-20-million-monthly-players-in-the-last-12-months

    [7] https://www.pocketgamer.biz/asia/news/71961/minecraft-300-million-registered-users-china

    [8] https://www.windowscentral.com/minecraft-live-2021-numbers-update

    [9] https://playercounter.com/minecraft

    [10] https://minecraft-statistic.net/en/global_statistic.html

    [11] https://www.statista.com/statistics/972711/minecraft-mobile-revenue/

    [12] https://www.statista.com/statistics/680139/minecraft-active-players-worldwide/

    [13] https://www.statista.com/statistics/1109046/minecraft-number-viewers/

    [14] https://app.sensortower.com/ios/us/mojang/app/minecraft/479516143/overview

    [15] https://app.sensortower.com/android/us/mojang/app/minecraft/com.mojang.minecraftpe/overview

    [16] https://www.gamesindustry.biz/articles/2018-05-24-minecraft-reaches-100-million-downloads-in-china

    [17] https://www.kitguru.net/desktop-pc/mustafa-mahmoud/minecraft-surpasses-400-million-players-in-china-alone/

    [18] https://www.pocketgamer.biz/asia/news/71961/minecraft-300-million-registered-users-china/

  • 2026 Pokemon Go Statistics That Prove This Game Is Still Popular

    2026 Pokemon Go Statistics That Prove This Game Is Still Popular

    Let’s face the facts here. At some point, we all wanted to become like Ash and have our very own Pokemon to do battle with. The TV shows, the video game franchise, and the trading card game did little to satiate our thirst to be the very best, that no one ever was.

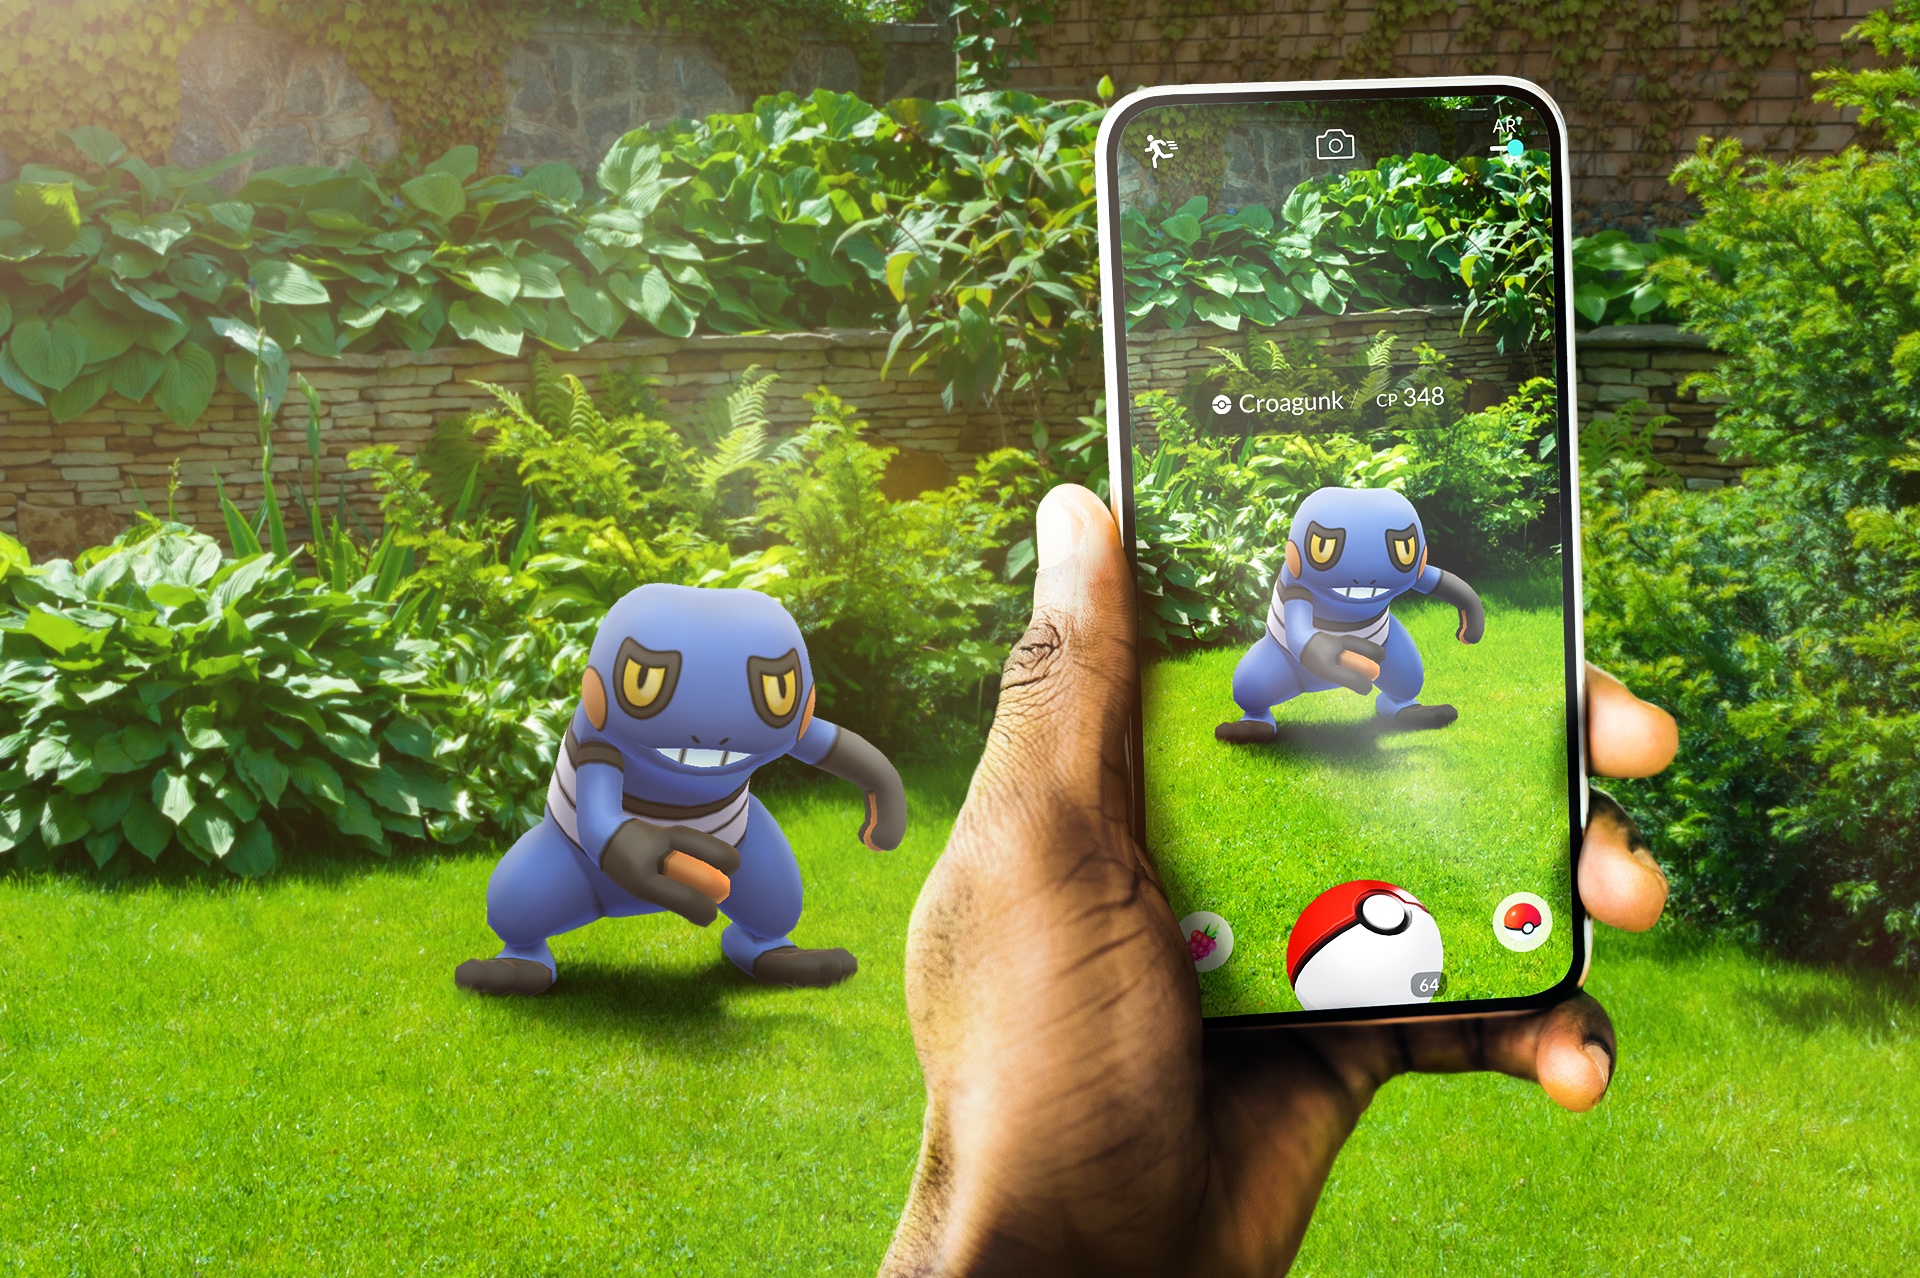
    Pokemon Go Sample Pokemon Go Statistics

    Sure, the different video game titles made us Pokemon Masters in our own right, but there was something missing. The feeling you get when you captured a Pokemon in a video game wasn’t as satisfying as Ash made it look like on TV.

    Then came Pokémon Go in 2016, and after its release in 2016, all people wanted to do was Pokémon Go. But what was the hype about? Why did Pokémon Go make the kind of impact that it had on the world?

    For the uninformed, Pokémon Go is an AR or Augmented Reality downloaded mobile game, available on both Apple App Store and Android Google Play Store. The premise of the game was simple and pretty much standard to the previously released video games.

    The gameplay of Pokémon Go has its users encounter different Pokemons in the real life using their mobile GPS and Camera. Users will catch and train these different Pokemons and go up against other trainers or other Pokemons.

    Pokémon Go was developed by Niantic, a game developer that specialized in augmented reality games. They originally started out as an internal startup within Google. The Pokémon Company, which handled brand management, marketing, licensing, and production, was the middleman.

    The game was launched in 2016 and instantaneously became an overnight hit. On its first month, it generated $207 million in revenue even though the release dates were staggered. It ended up being the most downloaded mobile game and earned $100 million within 20 days after its release [1].

    In this article, we’ll be going over the different numbers and look at the data behind Pokémon Go.

    Key Pokemon Go Statistics

    • Pokémon Go earned $107 million in revenue in its first month, breaking one of five Guinness World Records [1].
    • Niantic, the augmented reality company behind Pokémon Go, is valued at $9 billion [3].
    • Revenue from in game purchases was $904.62 million in 2021 [4].
    • 38% of Pokémon Go’s annual revenue is from the USA [4].
    • Average live player count for the last 30 days worldwide was 78 million [10].
    • Average daily active users for the last 30 days worldwide was 8 million [8].
    • Google Play accounted for 487 million downloads as of July 2021 [10].
    • Apple App Store accounted for 144.8 million downloads as of July 2021 [10].

    How Much Does Pokemon Go Make?

    • Niantic got a $300 million investment from Coatue at a $9 billion valuation [2].
    • Niantic’s Valuation from 2015 to 2021 are as follows (in billions) [3]:
      • 2015 – 0.15
      • 2016 – 3.65
      • 2019 – 4
      • 2021 – 9
    • In 2021, Pokemon Go generated $904.62 in annual revenue in in-app purchases worldwide [4].
    • Revenue share from the following regions are as follows [4]:
      • $348.73 million in Americas
      • $418.07 million in Asia Pacific
      • $137.07 million in EMEA
    • 38% of Pokémon Go’s annual revenue came from the United States, with Japan coming in second at $286 million, and Germany with $54 million.
    • Player spending in Pokémon Go at the start of the global Covid-19 Pandemic (March 16 2020) peaked at $7.8 million in the United States and $23 million worldwide [5], [6].
      • The United States accounts for 34% of the worldwide annual revenue for that week of observation [5], [6].
    • Pokemon Go Fest 2019 generated $249 million in revenue. The locations for the Pokémon Go Fest were in Chicago, Montreal, Dortmund, and Yokohama [7].
      • Chicago generated $120 million.
      • Montreal generated $71 million
      • Dortmund generated $56 million
    • More than 64,000 trainers were in attendance in Chicago, 86,000 in Dortmund, and 39,000 in Montreal.
    • Pokemon Go revenue from player spending hit $1 billion by the end of 2020 [10].
    • Even during the Pandemic, Pokémon Go Fest 2020 generated $17.5 million in revenue [8].
      • The event was online and made possible thanks to Niantic, even though some players still went outside.
      • Player spending for the first day was $8.9 million and $8.6 million for the next day.
    • Pokémon Go Fest 2021 generated $21 million in revenue [9].
      • Similar to the previous year’s event, the Pokemon Go Fest 2021 was held online.
      • Player spending was $11 million for the first day and $9.8 million for the second day.
      • The event was celebrated by trainers coming from 20 different countries.

    How Many Players Does Pokémon Go Have?

    • Live player count for Pokémon Go within the last 30 days (or as of July 2022) was 78.2 million [10].
    • Daily active users for that same period of observance peaked at 8.4 million [10]. The number of Pokemon Go Players have surpassed WoW players in terms of daily active users. According to World of Warcraft Statistics, daily active users hover at about 1 million.
    • The recorded number of Pokémon Go Players worldwide in 2020 is 603 million [11].
      • Asia Pacific had the highest share of player count with 311 million, accounting for 51% of the total number of players worldwide.
    • The average age of Pokémon Go Players is 26 [12].
      • The 21 to 25 year old age group comprises 32.6% of the Pokémon Go players, followed by the 26 to 30 years old age group with 25.4% [12].
      • 58.7% of players are male, and 41.3% are female [12].
    • Pokémon Go players spend an average of 1 to 2 hours a day playing, but there’s a small group of players who spend at least 2 to 3 hours daily.
    • Pokémon Go has 35,000 sponsored locations that 500 million players have visited [14], [15], [16].
      • Niantic earns anywhere between $0.15 and $0.50 for every user visiting a sponsored location
      • Sponsored locations include Softbank, Sprint, and Starbucks.
      • Niantic also pushed for a program that allowed small businesses to become Pokeétops or even Pokémon gyms.

    Pokémon Go Download Statistics

    • Cumulative downloads for Pokémon Go are as follows (in millions) [17]:
      • 2016 – 260
      • 2017 – 335
      • 2018 – 394
      • 2019 – 452
      • 2020 – 514
      • 2021 – 572
    • Pokémon Go was downloaded 487 million times from the Google Play Store as of July 2021 [18], [19].
    • Pokémon Go was downloaded 144.8 million times from the Apple App Store as of July 2021 [18], [19].
    • Pokémon Go has hit a total of more than a billion downloads since the game launched.

    How Many People Have Stopped Playing Since Launch?

    As of July 2022, there are still close to 71 million players logging in monthly, but the daily active user number is about 8 million. This is a farcry from the 500 million downloads that the mobile game generated on its first year of launching.

    But Pokémon Go still generates an average of 8 million players within the last 30 days, so it’s safe to say that the number of people who play Pokémon Go goes up and down frequently. The app may have lost 80% of its playerbase since launching, but with millions of players still playing Pokémon Go, the game still have some punch left.

    Unlike franchises like World of Warcraft, Pokemon Go never really went on to make expansions or addons or DLCs. They stuck with what their system currently has, and are improving on the go.

    Do People Still Play Pokémon Go?

    Pokemon Go Teams Pokemon Go Statistics

    The numbers don’t lie. Yes, the fad has died after the game launched in 2016. No one’s flocking to different venues the way they used to when the game launched. The people that play Pokémon Go are those that have built up a strong team and/or have invested a lot of time and money into the game. We can’t blame them. The usage statistics even show that the daily active users are still within the six to seven figures globally. Player spending a couple of years ago during the onset of the pandemic hit $1 billion, and this was with people being locked down.

    It’s worth noting that people may have stopped playing Pokemon Go because other mobile games such as Genshin Impact have come out and dominated the market. In fact, Genshin Impact player statistics revealed that the monthly average for mobile users hovers close to 4 million.

    In game purchases will probably still be in the seven or eight figure range by the end of 2022, but more revenue might still be recorded. Pokemon Go players will still be spending money for in game purchases. With new mobile devices being launched, Pokemon Go players might be more motivated to play even more.

    The Pokémon Go community is still thriving and vibrant. Each country or city plays hosts to a couple of hardcore groups, regardless if they belong to Team Mystic, Team Valor, or Team Instinct.

    How many Pokemon could Niantic add to keep the game fresh? As long as the Pokémon franchise continues to crank out different Pokémons, Nintendo’s market within the mobile gaming industry will still be noticeable with Pokémon Go.

    Will Pokémon Go still be one of the top mobile games this year? Who knows? It was the fastest mobile game to earn a lot of money that it broke a world record. They were the top grossing mobile game, and games like Genshin Impact are now dominating the mobile gaming industry. But with the numbers shown for usage stats, Pokémon revenue, and other data, we can safely conclude that Pokémon Go is here to stay for iOS devices and Android Devices.

    References

    [1] https://www.guinnessworldrecords.com/news/2016/8/pokemon-go-catches-five-world-records-439327

    [2] https://nianticlabs.com/news/coatue/?hl=en#:~:text=Niantic%20Receives%20%24300%20Million%20Investment%20From%20Coatue%20%E2%80%93%20Niantic%20Labs&text=Niantic%20Inc.%2C%20developer%20of%20the,a%20valuation%20of%20%249%20billion.

    [3] https://www.crunchbase.com/organization/nianticlabs

    [4] https://www.statista.com/statistics/665623/revenue-from-pokemon-go-global-region/

    [5] https://www.statista.com/statistics/1109967/pokemon-go-player-spending-coronavirus-usa/

    [6] https://www.statista.com/statistics/1109966/pokemon-go-player-spending-coronavirus/

    [7] https://www.pocketgamer.biz/news/76928/pokmon-go-fest-2021-generated-over-20-million-in-two-days

    [8] https://www.gamesindustry.biz/articles/2020-07-28-players-spent-usd17-5-million-during-pok-mon-go-fest-2020

    [9] https://www.vg247.com/pokemon-go-gest-2021-21-million-revenue

    [10] https://activeplayer.io/pokemon-go/

    [11] https://www.statista.com/statistics/665640/pokemon-go-global-android-apple-users/

    [12] “How Players Across Gender And Age Experience Pokémon Go?”. Universal Access In The Information Society, vol 19, no. 4, 2019, pp. 799-812. Springer Science And Business Media LLC, doi:10.1007/s10209-019-00694-7

    [14] https://www.theverge.com/2017/6/1/15724196/niantic-pokemon-go-sponsorship-app

    [15] https://www.thegamer.com/niantic-pokemon-go-local-business-recovery-initiative

    [16] https://www.adweek.com/performance-marketing/pokemon-go-update-adds-avatar-clothing-inspired-by-pokemon-ultra-sun-and-ultra-moon

    [17] https://appmagic.rocks/product-deck

    [18] https://sensortower.com/blog/pokemon-go-five-billion-revenue

  • 2026 Impressive Twitch Statistics That Will Shock Its Users

    2026 Impressive Twitch Statistics That Will Shock Its Users

    Twitch is probably the largest livestreaming platform with a keen focus on video games, and some other forms of entertainment. The platform was founded in 2011 by Justin Kan as a spinoff of his previous project, Justin.TV. Justin.TV was a single channel platform that broadcasted his daily life and activities around the clock, thus giving birth to “Lifecasting”.

    The website attracted other users who wanted to follow in Kan’s footsteps of broadcasting their day-to-day activities. At the same time, they didn’t want to watch Kan do stuff all day as well. Acting on this newfound interest for the platform, Kan relaunched Justin.TV in 2007 and allowed its users to create their own channels and broadcast content.

    After the launch, user interest for streaming video game piqued, but it wasn’t really the sole purpose of the platform. But with the overwhelming demand, the gaming category of Justin.TV branched out into Twitch.TV.

    Twitch as a platform outgrew Justin.TV by a mile, which left Kan to pivot and rebrand. Justin.TV shut down in 2014.

    In 2014, Amazon did to Twitch what Google did to YouTube, and that was to acquire the platform. Amazon purchased Twitch for $970 million that same year [1], which left people wondering if Amazon did the right thing.

    Twitch statistics further showed that traffic still grew with more than a million broadcasters and up to a hundred million monthly viewers a month on average. Since then, that number grew and we now have streamers like Ninja hosting 18.5 million followers and generating six-figure views every time he goes live.

    In this article, we’ll go over some very interesting Twitch statistics, including but not limited to highest earning Twich channels, number of Twitch users and unique viewers, and more.

    Key Twitch Stats

    • Twitch was acquired by Amazon for $970 million cash [1].
    • Twitch generated 15.54 million mobile device downloads in Q4 of 2021 [2].
    • Twitch earned $74.47 million in revenue through in-app purchases in Q4 of 2021 [3].
    • There are 7.47 million active streamers on Twitch as of June 2022 [11].
    • The United States accounts for 21.55% of Twitch desktop traffic within a six-month period of observation [12].
    • Gender distribution for Twitch users is 65% male and 35% female [15].

    How Much Is Twitch Earning?

    Revenue Generated Through IAP Twitch Statistics

    So how much is twitch earning in terms of ads, IAP, and downloads?

    • In Q4 2021, Twitch app generated 15.54 million downloads to all mobile devices, and downloads for the mobile app continue to increase significantly [2].
    • In Q4 2021, Twitch generated $74.97 million in revenue through in-app purchases (IAP) worldwide. The app is available on Android and iOS devices globally [3].
    • In 2020, Raul Alvarez, or AuronPlay, was the highest earning Twitch streamer based on advertising income. The streamer generated $545,245 in earnings just from advertising [4].
    • In 2019, Amazon generated $1.54 billion in revenue, higher than Youtube’s $1.46 billion that same year [5].
    • 2021 was a great year for Twitch. The platform hit $1 billion in consumer spending, making its way into the top 10 non-gaming apps with the highest annual consumer spending [6].

    On the platform, you’ll find their virtual products called Bits. These products allow you to financially support their creators, on top of the monthly subscriptions that’s shared to these partnered and affiliated Twitch channels.

    When a Twitch channel is subscribed to, or given bits to, the viewer unlocks several perks such as subscriber-only emojis, their own icons, and more. Twitch streamers can also create raffles where subs and bits donated are considered as entries.

    Which Streamers Have The Most Twitch Viewers?

    As of August 2022 and spanning 30 days since, here are the top 10 Twitch streamers with the highest Twitch viewership. (The following figures are for average number of viewers) [8]:

    • AuronPlay – 80,090
    • Rubius – 78,706
    • AdinRoss – 72,375
    • loud_coringa – 67,566
    • IlloJuan – 67,435
    • Ibai – 66,780
    • xQc – 65,284
    • AsmonGold – 53,021
    • Elspreen – 51,961
    • QuackityToo – 50,341

    Twitch Channels With Most Number of Followers

    Most Popular Twitch Channels Twitch Statistics

    As of July 2022, here are Twitch statistics for the most popular Twitch channels according to number of Twitch followers [9]:

    1. Ninja – 18.29 million
    2. AuronPlay – 13.29 million
    3. Rubius – 12.45 million
    4. Ibai – 11.32 million
    5. Tfue – 11.13 million
    6. xQc – 11.01 million
    7. Shroud – 10.23 million
    8. TheGrefg – 10.04 million
    9. Pokimane – 9.22 million
    10. SodaPoppin – 8.79 million

    Twitch Game Stats

    Twitch viewership for these games are at an all-time high, consistently. On these list you’ll find the most watched video games for the current year [10]. Note that we will not be including the category “Just Chatting”.

    • League of Legends – 5,928,342,296 hours watched
    • Grand Theft Auto V – 5,377,731,263 hours watched
    • VALORANT – 4,228,151,402 hours watched
    • Apex Legends – 2,542,277,982 hours watched
    • Counter-Strike: Global Offensive – 2,526,933,007 hours watched
    • Fortnite – 2,384,836,264 hours watched
    • Dota 2 – 1,766,606,660 hours watched
    • Lost Ark – 1,643,775,419 hours watched
    • Minecraft – 1,622,920,242 hours watched
    • Slots – 1,619,016,830 hours watched

    These are the most popular games on Twitch this year, with the numbers in total amount of Twitch concurrent viewers the game has had for a given time frame. In this case, these are the number of viewers that the game has had for 2022.

    And yes, people do spend time watching other people build and design Minecraft houses.

    The numbers don’t lie for these Twitch statistics as well. The more views a Twitch game has, the more popular it is in the platform.

    League of Legends continues to be the most popular game on Twitch right now as it’s consistent with concurrent viewers and Twitch viewership for their e-sports is almost always within 5 or 6-digit numbers.

    It’s worth noting that League of Legends and Grand Theft Auto V are neck and neck in terms of bagging the top spot for most watched game (excluding the Just Chatting categories).

    The Just Chatting category, which is the category that non-gamers are putting their content on, has the highest total number of views consistently. This category does not stream the most popular games, but rather you’ll find musicians, chefs, podcasts, and more. Viewership for this category alone is always in the millions every month.

    Most Viewed Games Twitch Statistics

    Statistics On Twitch Users

    • As of June 2022, there are 7.47 million active streamers on Twitch, which was down from 9.8 million recorded in January of 2021 [11].
    • For six months ending in May 2022, The United States accounts for 21.55% of Twitch desktop traffic worldwide, and Germany following with 6.87% [12].

    Since its inception in 2011, the number of Twitch partners increased tenfold. The Twitch Partner scheme is their revenue program for streamers and content creators. Twitch content creators will need to meet certain requirements such as number of hours streamed, average viewers, and number of days streamed to qualify for the program.

    The first level of the program is Twitch Affiliate. This allows streamers to earn through ad revenue and through subscriptions. Twitch Partner is the highest level of the program and content creators that become Partners get more incentives and a more generous compensation package.

    From 2012 to 2021, here is the Twitch stats for number of Partners (those who qualified for Affiliate or Partner) worldwide (in million) [13]:

    • 2012 – 3.4
    • 2013 – 5
    • 2014 – 10
    • 2015 – 13.5
    • 2017 – 27
    • 2019 – 35.6
    • 2020 – 51.48
    • 2021 – 51.5

    Twitch Demographics

    Twitch Demographics Twitch Statistics

    Age distribution of users are as follows (in%) [15]:

    • 16 to 24 years old – 41%
    • 25 to 34 years old – 32%
    • 35 to 44 years old – 17%
    • 45 to 54 years old – 7%
    • 55 years and older – 3%

    Gender distribution for Twitch users as of 2021 [15]:

    • Male – 65%
    • Female – 35%

    Interesting Twitch Viewers and Users Behavior

    • 58% of Twitch users posted a product review, service, or company in the past month, or posted a comment in a forum in the previous month [15].
    • 45% of Twitch users mentioned that they’d buy a product simply because of the experience provided by the community that’s built around it [15].

    Other Interesting Twitch Streamer Statistics

    • The average concurrent viewers for 2022 is 2,567,762 [15].
    • The number of 24-hour average viewers is 2,464,222 [15].
    • The ratio of viewers to streamers is 27.6% (2,567,762 viewers is to 92,971 streamers) [15].
    • The average concurrent channels is 95.5k [15].
    • Average monthly broadcasters for 2022 is 7.93 million. In 2021, the average monthly broadcasters is 8.46 million [15].

    Wrap Up

    With that said, we’ve answered a lot of questions, like how many people watch Twitch streams or how many viewers are certain video games getting, and more. Concurrent viewers are always within the five-digit range, and the hours watched on a monthly total are always in millions.

    Let’s not forget the fact that the consumer spending for Twitch has reached $1 billion in 2021, making them one of the top 10 non-gaming apps for consumer spending.

    Reference

    And the Twitch stats just prove how big the streaming platform is compared to other platforms (i.e. YouTube and Facebook Live). The top video games hosted on Twitch are generating a billion hours or so every year, and the numbers just keep rising.

    [1] https://www.businessinsider.com/amazon-buys-twitch-2014-8

    [2] https://www.statista.com/statistics/509989/twitch-monthly-unique-visitors-worldwide/

    [3] https://www.statista.com/statistics/517907/twitch-app-revenue/

    [4] https://www.statista.com/statistics/1248067/top-earning-twitch-streamers-advertising-revenue/

    [5] https://www.theloadout.com/twitch/youtube-revenue

    [6] https://www.digitalmusicnews.com/2022/02/01/twitch-surpasses-one-billion-consumer-spend-2021/#:~:text=Twitch%20surpassed%20%241%20billion%20in,by%20annual%20global%20consumer%20spend.

    [7] https://socialblade.com/twitch/top/100

    [8] https://twitchtracker.com/channels/viewership/personality

    [9] https://www.statista.com/statistics/486914/most-popular-twitch-channels-ranked-by-followers/

    [10] https://twitchstats.net/all-time-views

    [11] https://www.statista.com/statistics/746173/monthly-active-streamers-on-twitch/

    [12] https://www.statista.com/statistics/511558/twitch-traffic-by-country/

    [13] https://www.statista.com/statistics/1132996/number-twitch-partners/#statisticContainer

    [14] https://www.statista.com/statistics/746173/monthly-active-streamers-on-twitch/

    [15] https://blog.gwi.com/chart-of-the-week/the-rise-of-twitch/

    [16] https://sullygnome.com/90

    [17] https://sullygnome.com/longtermstats

    [18] https://sullygnome.com/games/2021/

  • 2026 Fortnite Statistics That Will Shock The World

    2026 Fortnite Statistics That Will Shock The World

    Everyone’s probably heard of this game already, if not have seen it more than they heard of it. People who don’t even know the game might have seen clips of it in social media sites. You ever seen a clip where someone was shooting someone else the first minute and building something the next? Well, that is Epic Games’ Fortnite, and we’re going to be looking at the numbers behind this global phenomenon of a video game.

    What is Fortnite exactly?

    Fortnite is a free to play game set in a zombie-infested and post-apocalyptic universe. You and up a hundred people will fight your way through a shrinking map, but you don’t exactly start out like you would with Counter-Strike: Global Offensive.

    You’re not buying any weapons here. Instead, you’re going to have to roam the entire map, looking for a place to hide or loot. The premise is simple: survive and be the last man (or woman) standing.

    The game was developed by Tim Sweeney and released by Epic Games Inc in July 2017. However, the appeal of Fortnite wasn’t exactly immediate. It was cartoonish and the premise wasn’t as unique as the rest of the first person shooting games out there. In fact, it kind of reminded people of a more cartoonish PUBG.

    But eventually it grew and caught hype, mostly by a lot of professional FPS players like Ninja. Then the rest is history. Fortnite statistics show that the game is now worth more than a billion dollars, and we’re going to be taking a look at more numbers outside of the game’s revenue.

    Key Fortnite Statistics

    • Fortnite earned $5.8 billion in revenue for 2021 [1], [2].
    • Since 2018, Fortnite is close to earning $20 billion in revenue [1], [2].
    • 77% of players in the USA spent money in Fortnite [3].
    • $102.42 was the average spending of Fortnite players in the USA in 2020 [4].
    • There are 400 million registered users in Fortnite as of 2021 [1].
    • 87% of the Fortnite playerbase globally is comprised of male players [10].
    • The average age of a Fortnite player is between 18 and 24 [10].
    • 26% of preteens in the United States consider Fortnite as their most favorite game [7].
    • Tyler Blevins, or Ninja, is the biggest Fortnite streamer on Twitch with 18.7 million followers [11].
    • Fortnite generated 11 million hours viewed on Twitch in July 2022 [16].

    How Big Is Fortnite?

    Fortnite Main Fortnite Statistics

    Under the Fortnite franchise are two games: Fortnite: Battle Royale and Fortnite: Save the World. The latter was released through a paid-for-early access back in 2017 and has yet to be released officially with rumors of a free to play game version.

    Fortnite: Battle Royale is the game that we’re going to be centered on. A free to play game, Fortnite: Battle Royale pits you and 99 other players into a storm-ridden island. You have to fight, build, and survive the entire match, or at least be in the top ranking survivors.

    The twist, however, is that the map continues to shrink. Even though you’re doing your best to avoid the crowd and wait it out, you’re going to meet other players sooner or later. Fortnite is played on different platforms: PC, PS4 and PS5, Xbox One, and Nintendo Switch.

    Unlike most shooting games like Call of Duty and Rainbow Six: Siege, Fortnite does not border on realism. In fact, it’s far from being realistic. The cartoonish appeal, the weird sound effects, and the hilarious dance sets are just a few of the many reasons why so many people play Fortnite. And when that many people play Fortnite, it’s bound to get the attention of the marketing world. Sure enough, bigger franchises such as Marvel and DC are now turning their heads towards the game by providing them with aesthetics, dances, and other features. Another thing that draws players into the game is that it’s not graphically-intensive compared to Call of Duty, so a budget PC with a midrange gaming card is all that you need to run at high settings.

    But we’ll talk more about that later on.

    How Does Fortnite Generate Revenue?

    Fortnite Cosmetics Fortnite Statistics

    Epic Games’ Fortnite is a free to play game, so how exactly is it generating money? How is it generating hundreds of millions of dollars in Fortnite revenue?

    Well, you don’t need to pay to access the full features of the game. That’s what sets it apart from the other games you see. When people play Fortnite for free, they are not hindered by any form of pay walls, and when we say pay walls, we mean they don’t have to purchase anything to access content.

    This popular battle royale game makes money off of one thing: microtransactions. That’s when a game, or an app, includes different features or aesthetics that don’t affect the performance or competitive nature.

    Fortnite has these player costumes, or skins if you will, which they can purchase to customize their characters. These ancillary products are the reason that make up most of the Fortnite revenue all throughout the years. Other games such as League of Legends and Dota 2 also have these features that allow them to earn revenue through microtransactions.

    The game also includes what’s called a Battle Pass, which is a quarterly subscription for $9.50 and generates most of the revenue for Fortnite. This quarterly fee will give players exclusive access to in-game content such as map changes, character features, and other features that a free player gets. Items included in the Battle Pass or in their store do not give anyone a competitive advantage.

    The items that are included in the Battle Pass are also available for a separate purchase, so players who are just after a particular item can buy them for a cheaper price without having to invest in a Battle Pass. A win-win situation for both players and Fortnite.

    On top of their microtransactions, players can also purchase in-game currency called V-Bucks, which you can use to purchase cosmetics, dances, and pre-released game modes. The denomination of these V-Bucks range from 200 to 2,000 ($2 to $20, respectively).

    And as expected of any video game, Fortnite lures players in with limited access, or limited time only, deals to incentivize players to buy on impulse. And it works.

    Fortnite Revenue

    • Fortnite annual revenue from 2018 to 2021 are as follows [1], [2]:
      • $5.4 billion in 2018
      • $3.7 billion in 2019
      • $5.1 billion in 2020
      • $5.8 billion in 2021
    • 77% of players in the USA have spent money on Fortnite in a February 2020 survey [3].
    • Lifetime average spending of players in the USA for the years 2018 and 2020 are [4]:
      • $84.67 in 2018
      • $102.42 in 2020
    • Fortnite has 85% of gamer share in the USA in terms of purchasing DLC according to a 2019 survey [5].
    • Fortnite is one of the leading e-sports games worldwide in terms of cumulative prize pool, sitting at 4th ranking with $19.27 million for 2021. Dota 2 ranks 1st in terms of cumulative prize pool with $47.74 million for the same year of observance [6].

    Fortnite Users

    • The number of registered players in Fortnite from 2017 to 2021 are [1]:
      • 20 million registered players in 2017
      • 125 million registered players in 2018
      • 250 million registered players in 2019
      • 350 million registered players in 2020
      • 400 million registered players in 2021
    • 26% of preteens in the United States consider Fortnite as their most favorite video game [7].

    During the onset of the Covid-19 pandemic in April 2020, gamers played Fortnite to fend off boredom. International RnB superstar Travis Scott took this chance and collaborated with Fortnite by hosting a live event within the game called Fortnite: Astronomical. And the numbers were staggering [8]:

    • 45.8 million players had access to all five live events
    • 27.7 unique players with access to all five events
    • 12.3 concurrent players who participated in the first event

    Who Plays Fortnite?

    Fortnite Gender Demographics

    Majority of the Fortnite playerbase is male, comprising 87% of the player base globally. In contrast, only 10.3% of their playerbase is female [10].

    What’s The Average Age of Fortnite Players?

    Distribution of age and percentage of users are as follows [10]:

    • 62.7% for the 18-24 age group
    • 22.5% for the 25-34 age group
    • 12.7% for the 35-44 age group
    • 2% for the 45-54 age group
    • 0.1% for the 55+ age group

    It’s safe to say that the average age of Fortnite players is between 18 and 24 years old, seeing as they comprise 62.7% of the game’s population worldwide.

    Who Are The Top Fortnite Streamers?

    • In February 2021, Fortnite generated 127 million hours of watched online video content and ranks as the first amongst other battle royale games across different streaming platforms [12].
    • In April 2021, Fortnite generated 94.1 million hours viewed on Twitch [13].
    • For the month of January 2022, Fortnite’s peak viewer count reached 403,757 [14].
    • For April 2022, Fortnite generated 71.1 million hours viewed on Twitch [15].
    • As of July 2022, Fortnite is one of the top games on Twitch in terms of number of hours viewed at 11 million. Grand Theft Auto V retains the #1 spot with 32.2 million hours [16].

    So who are the people on Twitch that’s making Fortnite as one of the most popular games in the world right now [10]?

    1 – Tyler ‘Ninja’ Blevins – 17 Million Twitch Followers

    Tyler Ninja Blevins Fortnite Statistics

    If anyone was going to appear on this list, it would be Tyler Blevins, or who people know as Ninja. He picks up first place because he was the reason why Fortnite is so successful. He currently has 18.7 million followers on Twitch as of August 2022 and remains as one of the most popular content creators of all time.

    2 – Cody ‘Clix’ Conrod – 5.4 million Twitch followers

    Cody Clix Conrod Fortnite Statistics

    Clix is one of the most popular Fortnite players, belonging to NRG. He’s considered to be one of the best Fortnite players of all time, right alongside Bugha.

    As of August 2022, Clix has about 5.4 million Twitch followers with 1.7 million subscribers on his YouTube channel. He was also the most watched Fortnite streamer in April 2021.

    3 – Kyle ‘Mongraal’ Jackson – 5.2 Million Twitch Followers

    Kyle Mongraal Jackson Fortnite Statistics

    A member of the FaZe clan, Mongraal is one of the few people on this list who’s going to make it big. While he hasn’t won any major events yet, he’s still one of the best players right now in the world.

    4 – Jesus ‘Jelty’ Navarez Espinoza – 2.8 Million Twitch Followers

    Jesus Jelty Navarez Fortnite Statistics

    Jelty was rated as the fastest rising Fortnite streamer in 2021 by Sportskeeda, and his metrics speak for themselves. Jelty is one of the best streamers out there, maintaining his position in the top 10 most watched Fortnite streamers as of Aug 2022 [17].

    5 – Josue ‘FaZe Sway’ Sway – 834,000 Twitch Followers

    Josue Sway Fortnite Statistics

    FaZe Sway is one of the more popular members from FaZe clan and is one of the best streamers out there for Fortnite. While he’s been streaming since 2017, his gaming forte turned out to be Fortnite and has streamed the game since. As of June 2021, Sway picked up 80,000 new followers just from streaming Fortnite.

    Reference

    [1] https://s3.documentcloud.org/documents/20696836/epic-apple-trial-epic-games-exhibit.pdf
    [2] https://www.statista.com/statistics/1238904/fortnite-revenue-annual/
    [3] https://www.statista.com/statistics/882071/fortnite-players-spending-money-in-game-purchases/
    [4] https://www.statista.com/statistics/1239662/fortnite-players-spending-total/
    [5] https://www.statista.com/statistics/1079067/dlc-purchasing-game/
    [6] https://www.statista.com/statistics/501853/leading-esports-games-worldwide-total-prize-pool/
    [7] https://www.statista.com/statistics/694860/favorite-gaming-apps-united-states-girls/
    [8] https://www.statista.com/statistics/1097635/fortnite-travis-scott-players/
    [9] https://www.eurogamer.net/fortnite-earned-usd9bn-in-two-years
    [10] https://vertoanalytics.com/chart-week-deep-dive-fortnite/
    [11] https://www.esportsbets.com/fortnite/streamers/
    [12] https://www.statista.com/statistics/1230663/top-battle-royale-games-livestreamed-by-hours/
    [13] https://www.statista.com/statistics/507786/leading-game-content-twitch-by-number-hours-viewed/
    [14] https://www.statista.com/statistics/1110372/twitch-popular-game-peak-viewers/
    [15] https://www.statista.com/statistics/1109384/fortnite-hours-watched-twitch/
    [16] https://www.statista.com/statistics/509814/leading-games-twitch-by-number-hours-viewed/
    [17] https://www.twitchmetrics.net/channels/viewership?game=Fortnite

  • 2026 App Revenue Statistics That Prove How Big The Mobile App Industry Is

    2026 App Revenue Statistics That Prove How Big The Mobile App Industry Is

    Mobile apps have changed the way we lived our lives, whether we want to admit it or not. We’re not just talking about being addicted to mobile games. We’re talking about using different mobile apps for different parts of our lives. We have mobile apps to communicate with one another, mobile apps to order food from or do groceries with, and even mobile apps to help us with our banking and bills.

    Mobile Apps App Revenue Statistics

    With our complete reliance on apps, it’s come as no surprise that the mobile app industry is a billion dollar industry, but just how big is the industry? What are the number for mobile app downloads telling us?

    How much is the mobile app revenue per platform? We’ll find out the answer to those questions and more.

    Key App Revenue Statistics

    • Mobile app users are spending $380 on in app purchases [1].
    • More than five million apps are spread out over the Google Play Store, Apple App Store, and Amazon App Store [2].
    • China remains as the leading market of consumer spending for mobile apps in 2021, generating $56.21 billion in revenue through app spending [3].
    • United States follows after China in consumer spending the same year of observance with $43.03 billion [3].
    • iOS users had the highest consumer spending within the Apple App Store for 2021 and 2022, with $85 billion and $92 billion respectively [4].
    • Consumer spending for Apple App Store is expected to reach $161 billion by 2026 [4].
    • Google Play Store’s consumer spending for the same year of observance was at $47 billion and $45 billion respectively [4].
    • Google Play Store consumer spending is projected to reach $72 billion by 2026 [4].
    • Apple’s global revenue was $365.31 billion in 2021 [13].
    • Mobile app gaming revenue on both Google Play Store and Apple App Store was $98.22 billion in 2021. It’s expected to reach $103.5 billion by the end of 2022 [6].

    Mobile App Revenue Statistics

    • China is the leading market for mobile apps consumer spending in 2021, accumulating $56.21 billion in app spending [3].
    • The United States follows in mobile app consumer spending with $43.03 billion that same year [3].
    • In 2021 and 2022, Apple App Store had the highest consumer spending at $85 billion and $92 billion respectively. It’s projected they will hit $161 billion in consumer spending by 2026 [4].
    • Likewise, Google Play Store recorded consumer spending for the same year of observance at $47 billion and $45 billion. It’s projected they will hit $72 billion in consumer spending by 2026 [4].
    • As of January 2022, WhatsApp is the most popular messaging platform in terms of monthly active users. WhatsApp recorded 2 billion users on a monthly basis [5].
    • WeiXin/WeChat follows in second place for most popular messaging platform with 1.2 billion monthly active users [5].
    • Mobile app gaming revenue on both platforms (Google Play Store and Apple App Store) was $98.22 billion in 2021. It’s estimated to reach $103.5 billion in 2022 [6].

    How Much Did Apple App Store Generate In Mobile App Revenues?

    Mobile Phone Usage App Revenue Statistics
    • Tinder is the leading iPhone App in terms of revenue in June 2022. The app earned $38.4 million for the month of June 2022 [7].
    • TikTok comes in second place with $28.72 million and Pokemon Go with $25.71 million [7].
    • As of 2022, the total number of gaming apps available on the Apple App Store is 288,153 [8].
    • The average price of both iOS games and apps is $0.88 as of November 2021.
    • 93.1% of all apps in the Apple App Store are Free Apps [9].
    • Only 6.3% of all the apps in the Apple App Store are Paid Apps [9].
    • The global revenue of the Apple App Store for the first half of 2021 and first half of 2022 was at $41.4 billion and $43.7 billion respectively [10].
    • For the years 2019, 2020, and 2021, the global revenue for the Apple App Store were $55.5 billion, $72.3 billion, and $85.3 billion [11].
    • Gaming apps has the highest download share amongst other apps from 2020 to 2021. Gaming apps will still remain the highest download share for the year of 2022 [12].
    • Apple’s global revenue worldwide is $365.82 billion as of 2021 [13].

    Apple continues to be the face of innovation, and it shows in their tremendous growth over the last ten years. Between the Macs, iPhones, iPads, and Apple Watches, each product line has their own dynasty and enjoying their individual successes. Their share price has increased tenfold and became the first trillion-dollar company (in market capitalization) [14].

    How Much Did Google Play Store Generate For Mobile App Revenues?

    Android Phone App Revenue Statistics
    • As of Q1 2022, there are 449,497 gaming apps in the Google Play Store [15].
    • As of June 2022, the top grossing apps in terms of revenue are Coin Master, Diablo Immortal, and TikTok. Their revenue for that month were $26.71 million, $26.17 million, and $23.5 million respectively [16].
    • There are 2.65 million apps available in the Google Play Store as of March 2022 [17].
    • Much like Apple App Store, gaming apps have the highest download share in the Google Play Store, maintaining at least above 40% download share amongst other apps in the store [18].
    • Google Play Store’s annual revenue for 2021 was $47.9 billion. In 2020, it was $38.8 billion [19].
    • In June 2021, Google Meet was the most popular app on Android in terms of download. The app generated 16.31 million downloads for the month. Google Play Games came in second place with 12.82 million times for the same month.

    All About The Google Play Store Ecosystem

    The Google Play Store was launched in March 2016 and became the major app distributor for Android users around the world, as well as being one of the most important mobile app stores in the mobile app industry.

    Much like the Apple App Store, you’ll find several app categories ranging from gaming to office productivity to social media and communications.

    Free Vs Paid App Downloads

    • Amongst three different platforms, the distribution of free and paid apps as of June 2022 are [21], [22], [23]:
      • 93.9% free apps; 6.1% paid apps in the Apple App Store
      • 96.8% free apps; 3.2% paid apps in the Google Play Store
      • 82.2% free apps; 17.8% paid apps in the Amazon Appstore
    • As of Sept 2021, 3.7% of apps found on the Google Play Store require an upfront payment before you can download or use the app, while Apple has 6% of apps that require an upfront payment [24].
    • During the same time of observance, only 12.5% of apps in the Apple App Store have in app purchases or subscriptions as part of their revenue generation business model. In contrast, Google Play Store has 6.6% of apps with in app purchases and subscriptions [24].
    • Global revenue of mobile apps reached $318 billion in 2020, which was more than an $60 billion increase compared to 2019. The strongest segment was the mobile games segment, generating $200 billion in revenue, followed by social media apps with $31 billion in revenue [25].

    In 2020, global revenue from mobile apps increased to over 318 billion U.S. dollars. This was an increase of over 60 billion U.S. dollars compared to 2019. The strongest segment that year was the mobile games segment with a revenue of over 200 billion U.S. dollars, followed by social networking mobile apps, which created a revenue of around 31 billion dollars. The Statista Digital Market Outlook estimates that revenue across most segments will increase over the next few years and overall will reach around 613 billion U.S. dollars by 2025.

    A Talk About App Monetization Strategies

    You might be wondering: how are free apps generating revenue when they give people free access to the apps? Well, the term that comes to mind here is FREEMIUM apps, or you need to pay a premium fee when you want to access certain content or features of a free app.

    These fees can come in the form of monthly subscriptions or through a one-time fee. Most apps also offer a lifetime subscription.

    Advertising within mobile apps is also one way of monetizing free apps. If you’ve ever downloaded a game or any kind of app, then you’ll know all about the annoying pop-up ads or banner ads that show up out of nowhere. Most of these ads are commonly found in gaming apps, but as long as there are free apps in the mobile app market, you’ll always see an ad or two.

    Some developers also include what they call an ad-free experience as part of their perks or benefits of paying an upfront fee. Again, this is common within the mobile app market, but you’re not exactly just paying to get rid of the ads.

    Reference

    [1] https://www.zdnet.com/article/mobile-apps-see-download-in-app-purchase-user-growth-globally-says-app-annie/

    [2] https://www.statista.com/statistics/276623/number-of-apps-available-in-leading-app-stores/

    [3] https://www.statista.com/statistics/1294605/global-mobile-app-spend-consumer-by-region/

    [4] https://www.statista.com/statistics/747489/annual-consumer-spend-mobile-app-by-store/

    [5] https://www.statista.com/statistics/258749/most-popular-global-mobile-messenger-apps/

    [6] https://www.statista.com/statistics/511639/global-mobile-game-app-revenue/

    [7] https://www.statista.com/statistics/271103/top-iphone-apps-worldwide-by-revenue/

    [8] https://www.statista.com/statistics/780238/number-of-available-gaming-apps-in-the-apple-app-store-quarter/

    [9] https://www.statista.com/statistics/1020996/distribution-of-free-and-paid-ios-apps/

    [10] https://www.statista.com/statistics/1322849/app-stores-global-revenues-first-half/

    [11] https://www.statista.com/statistics/296226/annual-apple-app-store-revenue/

    [12] https://www.statista.com/statistics/1322605/apple-app-store-downloads-share-by-category/

    [13] https://www.statista.com/statistics/265125/total-net-sales-of-apple-since-2004/

    [14] https://www.statista.com/statistics/216657/market-capitalization-of-us-tech-and-internet-companies/

    [15] https://www.statista.com/statistics/780229/number-of-available-gaming-apps-in-the-google-play-store-quarter/

    [16] https://www.statista.com/statistics/271674/top-apps-in-google-play-by-revenue/

    [17] https://www.statista.com/statistics/266210/number-of-available-applications-in-the-google-play-store/

    [18] https://www.statista.com/statistics/1322595/google-play-app-downloads-share-by-category/

    [19] https://www.statista.com/statistics/444476/google-play-annual-revenue/

    [20] https://www.statista.com/statistics/248959/top-global-google-app-downloads-google-play/

    [21] https://www.statista.com/statistics/1020996/distribution-of-free-and-paid-ios-apps/

    [22] https://www.statista.com/statistics/266211/distribution-of-free-and-paid-android-apps/

    [23] https://www.statista.com/statistics/256776/distribution-paid-free-amazon-appstore-apps/

    [24] https://www.statista.com/statistics/1269868/distribution-of-apps-worldwide-by-monetization-method/

    [25] https://www.statista.com/forecasts/1262892/mobile-app-revenue-worldwide-by-segment

  • 2026 Impressive Mobile App Usage Statistics That Will Shock You

    2026 Impressive Mobile App Usage Statistics That Will Shock You

    Let’s get the elephant out of the room: our modern way of life wouldn’t be possible without the existence of mobile apps, or mobile applications. In fact, we’ll just keep it generic and use the term apps because we’re also reliant on apps installed in our computers, tablets, and even certain appliances such as TV.

    How reliant are we when it comes to mobile apps? What’s the average mobile app usage right now? How much revenue is the mobile app industry generating every year? What are the mobile app user statistics telling us?

    We’ll have these questions answered and more in this article, and you’ll probably be surprised at the numbers.

    Key App Usage Statistics And Industry Data

    • Average consumer spending on mobile apps was $10.64 in Q4 of 2021, but declined to $5.03 during Q1 of 2022 [1].
    • Between 2019 and 2021, consumer spending on mobile apps followed an upward trend, but with minimal fluctuations [1].
    • Asia continues to be the leading market for consumer spending on mobile apps, raking in $56.72 billion spent for all users. United States smartphone users spent $43.03 billion for the same year and smartphone users from Japan followed with $20.75 billion [4].
    • Tencent Video is the highest-grossing mobile streaming app in terms of in-app purchase revenues. In June 2022, they earned $61.5 million, followed by HBO Max with $51.76 million [8].
    • The revenue for the mobile gaming apps category in 2021 reached $98.22 billion. It’s estimated to reach $103 billion by the end of 2022 [5].
    • Mobile gaming content market value was $131.2 billion in 2021, and it’s projected to reach $140 billion by 2022. In 2026, it’s estimated at $173.6 billion [7].
    • Three regions generated the highest revenue for IAP or in app purchases in the mobile gaming industry, namely APAC, Americas, and Korea [10].
    • There are 3.2 million apps in Google Play Store, 2.1 million apps in the Apple App Store, and 475,904 apps in the Amazon App Store [17].
    • Mobile app downloads will reach 145 billion by the end of 2022. It’s expected to reach 181 billion downloads by 2026 [22].

    Mobile App Usage Statistics on a Global Scale

    Person Using Smartphone App Usage Statistics
    • Mobile app users in Asia recorded the highest number of time spent on social media apps from the first half of 2019 to the first half of 2021. In 2019, they recorded 389,500 billion hours and 449,200 billion hours in 2021 [2].
    • In 2020, users spent an average of 18.78 minutes playing hyper casual gaming apps [3].
    • Between 2019 and 2020, time spent on shopping apps grew from 8.98 minutes to 9.18 minutes [3].
    • Asia is the leading market for consumer spending on mobile apps as of 2021, with $56.72 billion. They’re followed by the United States and Japan with $43.03 billion and $20.75 billion respectively [4].
    • Tencent Video was the leading streaming app in terms of in-app purchase revenues, earning $61.5 million for June 2022. HBO Max came in second with $51.76 million and iQiyi in third place with $46.2 million in revenue for the same month [8].
    • TikTok was the most downloaded mobile app in 2021 worldwide with 656 million downloads for the year. Instagram, Facebook, and WhatsApp follow after TikTok with 545 million, 416 million, and 395 million downloads respectively [9].
    • In terms of monthly active users for mobile messaging apps, WhatsApp is the most popular app as of January 2022 with 2 billion active users, followed by WeXin/WeChat with 1.263 billion and Facebook Messenger with 988 million.
    • For both Google Play store and Apple App Store, The Gaming category is the most popular app category. Google Play Store accounted for 13.62% of available apps globally and 10.15% for Apple Pay Store [12],[13].
    • In terms of IAP revenue generated by mobile messenger apps, LINE was the top-grossing app with $24.7 million in revenues alone, followed by QQ and WeChat with $15.27 and $7.4 million respectively [14].
    • 21% of millennials open at least one app more than 50 times daily [18].
    • 49% of people will open at least one app more than 11 times daily [19].
    • 70% of all digital media time in the USA comes from mobile app usage [20].
    • Smartphone users will use an average of 10 apps daily and 30 apps monthly [21].

    Gaming App Usage Statistics

    Two Kids Playing App Usage Statistics
    • Mobile gaming app revenue for 2021 was $98.22 billion, and is projected to reach $103.5 billion by the end of 2022 [5].
    • The Role-Playing Game (RPG) Genre was the top-grossing genre for mobile games, earning $18.3 billion in 2019 and $21.9 billion in 2020 [6].
    • The mobile gaming content market value is estimated at $131.2 billion in 2021, and is projected to hit $140 billion by the end of 2022 [7].
    • Mobile gaming content market value is projected to hit $173.6 billion by 2026 [7].
    • In-App Purchases (IAP) generated the highest revenue in several regions for mobile gaming industry, namely APAC (Asia Pacific), Americas, and Korea [10].

    Social Media Apps for Businesses?

    Between 2020 and 2021, social media apps only recorded a small decline in terms of time spent per user [15]. However, video social media apps and platforms was the trend for the time period. TikTok became one of the most downloaded mobile app for both iPhone and Android users. More companies are also utilizing social media platforms and mobile messaging apps within a business context.

    Gaming As Part Of The Mobile App Experience

    Mobile gaming is the most popular activity in terms of mobile app usage, for both Android and iOS users. The gaming category also recorded the highest number of average time spent per user.

    How Many Apps Are There In The World?

    • Even without putting an exact number on how many apps there are, mobile apps are expected to generate close to a trillion dollars in revenue by 2023 [16].
    • But to put an exact number on the number of mobile apps in all platforms, here’s what we have [17]:
      • 3.2 million apps for Google Play Store
      • 2.1 million apps for Apple App Store
      • 475,904 apps for Amazon App Store
    • Mobile app downloads will hit 145 billion on all platforms (Google Play Store and Apple App Store). It’s expected to hit 181 billion downloads by the end of 2026 [22].
    • In 2020, YouTube Music is the most popular music app in the Google Play Store with 9.42 million downloads.

    Whether it’s finances, travel, fitness, mobile games, or even virtual vaccine passports, mobile apps have become an integral part of our modern day living. We just cannot live without it, and the app usage statistics show it.

    We may not even be conscious at this point about our mobile app usage, except maybe for gaming. Non-gaming apps, from shopping to food/wine to sports, may not come close to just how many downloads mobile gaming apps get, but the numbers are still substantial. App downloads for all categories still show that people are using different kind of apps on their mobile phone.

    How Much Time is Spent On Apps?

    • Between 2018 and 2021, mobile app users spent 5.64 trillion hours using social and communication apps, followed by photo and video apps with 2.93 trillion hours spent, and gaming with 1.01 trillion hours spent [23].
    • Between Oct 2020 and Mar 2021, female mobile gamers spent 17.89 minutes on average playing mobile games daily, in comparison to male mobile gamers with an average of 15.73 minutes [24].
    • For the same year of observance (2020 and 2021), mobile gamers within the age group of 50 and above spent an average of 21 minutes playing games on their mobile devices daily. In comparison, smartphone users between the ages of 20 and 24 spent an average of 12.88 minutes, and the younger smartphone users between the ages of 0 and 19 spent an average of 13.08 minutes daily [25].
    • Between Oct 2020 and Mar 2021, smartphone users around the world spent an average of 55.48 minutes daily using social media and communication apps. Gaming is the second most popular in terms of user engagement with 16.7 minutes average, and entertainment apps in third place with 13.53 minutes [26].
    Average Monthly Hours Spent In Social Apps App Usage Statistics

    Social Media App Usage Statistics

    • Android app statistics show that their users spent 23.7 hours per month engaging in YouTube in 2021. This is followed by Facebook and TikTok tied in second place with 19.6 hours per month spent on each app. WhatsApp comes in third with 18.6 hours per month [27].
    • Between Oct 2020 and Mar 2021, mobile phone users between the ages of 40 and 44 years old spent the highest amount of time engaging with social media apps, averaging 59.85 minutes per day. In contrast, mobile phone users 19 years old and younger spent the lesat amount of time on social media, garnering 49.92 minutes per day on average [28].
    • 33% of survey participants done in 2021 spent more than 3 hours per day on social media apps and reported that it have negatively impacted their social wellbeing (i.e. not feeling close to others, or not a part of a supportive community) [29].
    • During Q2 of 2022, TikTok ranked highest in social media engagements with users spending 95 minutes per day. YouTube comes in second with 74 minutes on average daily, while Instagram comes in third with 51 minutes [30].
    • A 2021 survey showed that half of their respondents used social media to keep in touch with friends and family (47.6%), and 36.3% of their respondents use social media to kill the time. 21% of their respondents use social media to follow influencers and celebrities [31].

    Wrap Up

    With everything that’s presented, the numbers don’t lie. It’s clear that mobile apps are as part of our routine as eating breakfast, and the app usage statistics show it. We’re spending close to an hour each day on certain apps, be it social media apps, entertainment apps, food and dining apps, and even gaming on our mobile devices.

    References

    [1] https://www.statista.com/statistics/289909/mobile-app-spend-on-per-user-mobile-apps-quarter/

    [2] https://www.statista.com/statistics/1268491/global-time-spent-social-apps-by-region/

    [3] https://www.statista.com/statistics/243779/total-minutes-spent-on-average-app-by-category/

    [4] https://www.statista.com/statistics/1294605/global-mobile-app-spend-consumer-by-region/

    [5] https://www.statista.com/statistics/511639/global-mobile-game-app-revenue/

    [6] https://www.statista.com/statistics/260157/mobile-gaming-revenue-worldwide/

    [7] https://www.statista.com/statistics/292512/mobile-contents-market-value-worldwide/

    [8] https://www.statista.com/statistics/1251828/streaming-apps-iap-revenues/

    [9] https://www.statista.com/statistics/1285960/top-downloaded-mobile-apps-worldwide/

    [10] https://www.statista.com/statistics/674332/mobiel-games-usage-monetization-models/

    [11] https://www.statista.com/statistics/270291/popular-categories-in-the-app-store/

    [12] https://www.statista.com/statistics/279286/google-play-android-app-categories/

    [13] https://www.statista.com/statistics/270291/popular-categories-in-the-app-store/

    [14] https://www.statista.com/statistics/1227434/most-popular-messenger-apps-worldwide-by-monthly-iap-revenue/

    [15] https://www.statista.com/statistics/1268491/global-time-spent-social-apps-by-region/

    [16] https://www.statista.com/forecasts/1262892/mobile-app-revenue-worldwide-by-segment

    [17] https://www.statista.com/statistics/276623/number-of-apps-available-in-leading-app-stores/

    [18] https://mindsea.com/app-stats/

    [19] https://themanifest.com/app-development/blog/mobile-app-usage-statistics

    [20] https://www.oberlo.com/blog/mobile-usage-statistics

    [21] https://techjury.net/blog/app-usage-statistics/

    [22] https://www.statista.com/statistics/1010716/apple-app-store-google-play-app-downloads-forecast/

    [23] https://www.statista.com/statistics/1288896/global-time-spent-selected-app-categories/

    [24] https://www.statista.com/statistics/1272893/worldwide-game-apps-time-spent-daily-gender/

    [25] https://www.statista.com/statistics/1272891/worldwide-game-apps-time-spent-daily-age/

    [26] https://www.statista.com/statistics/1272800/worldwide-mobile-apps-time-spent-daily/

    [27] https://www.statista.com/statistics/1294865/time-spent-mobile-social-apps-worldwide/

    [28] https://www.statista.com/statistics/1272883/worldwide-social-apps-time-spent-daily-age/

    [29] https://www.statista.com/statistics/1314985/global-population-social-media-and-wellbeing/

    [30] https://www.statista.com/statistics/1322876/social-media-apps-time-spent-global/

    [31] https://www.statista.com/statistics/715449/social-media-usage-reasons-worldwide/

  • 2026 Mobile Gaming Demographics: Fully Researched

    2026 Mobile Gaming Demographics: Fully Researched

    Ten or fifteen odd years ago, no one would’ve ever thought to see mobile gaming become its own industry. Mobile gamers didn’t even exist at that time yet. You only had people who played mobile games on their phones.

    Mobile games weren’t even something that could compete against PC gaming and console gaming a decade or so ago, but here we are. Mobile gaming industry has become a giant in itself, and it’s beating out other segments of the video game industry by a huge margin.

    In this article, we’ll be looking at some important mobile gaming demographics that let us know why the mobile game market is where it’s at right now and find out where it’s headed in the next few years.

    Key Mobile Gaming Demographics and Statistics

    • Smartphone games had a 45% revenue share of the entire video gaming industry revenue as of 2022 (1).
    • In the USA alone, mobile gaming revenue reached $41.7 billion as of 2022, more than the entire revenue of the digital video games industry for 2021 (2).
    • As of 2021, there are 151.3 million mobile gamers in the USA, or people who play games on their phones. It’s projected that this number will go even higher and reach 181 million by 2027 (3).
    • F2P or Free To Play mobile games generated a revenue of $13.78 billion in the USA for the year 2021 (6)
    • The mobile gaming content market value of North America is estimated to reach $29.1 billion by the end of 22 (8).
    • Asia Pacific has the highest number of mobile gamers with 1.2 billion, followed by Europe and Latin America (15)
    • 8.2% of kids in North America spent more than $100 on average for microtransactions and in-app purchases for mobile games
    • Genshin Impact only took 6 months to generate $1 billion in player spending (27).
    • Genshin Impact is also the top-grossing Gacha mobile game for 2022 (30).
    • Gen Z, or people between the ages of 10 and 22 years old, have the highest share of the mobile gaming population (22).

    Mobile Gaming Industry Revenue and Statistics

    • Mobile gaming revenue (smartphones and tablets) accounted for 51% revenue share of the entire video gaming revenue in 2022. Smartphone games alone earned $91.4 billion in revenue, followed by console games with $58.6 billion and boxed/downloaded PC games with $38.7 billion (1).
    • At the start of 2018, mobile gaming segment had the highest revenue share for global gaming revenue. In 2021, revenue share of the mobile game segment was at 59% (4).
    • Mobile gaming app revenue from both Apple App store and Google Play Store is expected to reach $103 billion by the end of 2022 (5).
    • F2P (Free To Play) mobile games generated $13.78 billion in 2021 in the USA alone (6).
    • Consumer spending on mobile gaming apps was the highest category for the first three quarters of 2021 amongst other mobile app categories (e.g. shopping, food and drinks, entertainment, etc.) (7).
    • Mobile gaming content market value in North America is projected to reach $29.1 billion by the end of 2022. In 2021, mobile gaming industry content market value was at $27.7 billion (8).
    • Revenue for the mobile game market is expected to reach a CAGR (compound annual growth rate) of 7.31% for the year 2022, with $59.34 billion market value (projected) by 2027 (11).
    Female Gamer Playing On Phone Mobile Gaming Demographics

    The growth of the mobile games industry over the last decade is unprecedented. Generating more than half of the revenue share for the entire industry is no ordinary feat, and it’s clear just how many people are invested into playing mobile games. Let’s not forget the fact that F2P (free to play) mobile games are earning higher revenues than both console and PC gaming combined. Online game developers left and right are also quick to create hyper casual games that doesn’t take up a lot of your time and/or money.

    Mobile Gaming Market Segment

    • The United States accounts for more than 25% of revenue share in the mobile game industry compared to other regions. This currently makes them the biggest mobile gaming market in the world. This trend started in 2019 and only amplified at the onset of the Pandemic (9).
    • Despite the USA having the biggest mobile gaming market, APAC or Asia Pacific has the highest number of mobile gamers with 1.29 billion as of 2021 (10).
    • Revenue for the mobile game market is expected to reach a CAGR (compound annual growth rate) of 7.31% for the year 2022, with $59.34 billion market value (projected) by 2027 (11).
    • China is expected to generate the highest revenue share for mobile gaming industry for 2022 with $47.20 billion (11).
    • Mobile gaming market revenue for Asia Pacific was $69 billion as of 2021 (12). It’s projected to reach $109.6 billion by 2026.

    The Free To Play Business Model Was a Success

    The mobile gaming industry could attribute its growth to the success of the Free To Play business model. A lot of the most successful mobile games right now are Free To Play, such as Garena Free Fire and Genshin Impact, but both were considered two of the highest grossing mobile games in 2021 (13). PUBG Mobile also reached $163 million dollars in in-app purchase as of April 2022 (14).

    How Many Mobile Gamers Are There In The World?

    • As of 2021, there are 2.6 billion people who play games on their mobile phones(15).
    • Asia Pacific has the most number of mobile gamers with 1.2 billion, followed by Europe and Latin America with 551.7 million and 309.2 million respectively (15).
    • 21% of the mobile gamer population around the world spend an average of 1 to 7 hours per week on mobile gaming (16).

    Mobile Gaming Demographics by Gender

    • As of January 2021, the distribution of mobile gamers in the United States is 55% female and 45% male (17).
    • In Southeast Asia, majority of mobile game distribution within all six countries are males. The Philippines has the largest share of male gamers with 71%, while Vietnam has the lowest at 51.2% (18).
    • In the UK, the distribution of female gamers is 51% for mobile games and 49% for male gamers as of June 2021 (19).
    • Korea’s mobile gaming population is 51.8% male and 48.2% female as of June 2021.

    These numbers alone prove that the gaming industry, or the hobby of gaming in itself, is no longer dominated by male gamers. The share of gamers worldwide as of 2020 were equal for the following age groups (21):

    • 17% distribution for both male and female for gamers in the 21-35 age group
    • 15% distribution for both male and female for gamers in the 36-50 age group
    • 8% distribution for both male and female for gamers in the 51-65 age group
    • For the 11-20 age group, 11% are male gamers and 10% are female gamers

    Unfortunately there are no published mobile gamer demographics on a global scale. The following data for mobile gaming industry statistics come from selected countries and/or regions.

    Mobile Gaming Demographics by Age

    • 2020 data shows that Gen Z (age group 10-22) have the highest share of mobile gaming population at 79%, followed by Millenials (age group 23-38), and 68% are Gen X (age group 39-50) (22).
    • Between October 2020 and March 2021, mobile gamers aged 50 years and above spent an average of 21 minutes playing mobile games daily. In contrast, the youngest users aged between 20 and 24 years old spent the least time playing mobile games daily at 12.88 minutes (23)
    • 36.3 years old is the average age of mobile gamers (24)
    • More than 50% of parents in the USA have had kids make in-game microtransactions without their knowledge (26).
    • 8.2% of kids in the USA spend more than $100 on average for in-game purchases in mobile games (26).

    In terms of spending habits, data from June 2020 shows four countries with new gamers or users spending more on average than existing users: United States, United Kingdom, South Korea, and Germany (25).

    • New gamers from Germany spent an average of $35.48 monthly
    • New gamers from the United States spent an average of $27.2 monthly
    • New gamers from South Korea spent an average of $20.58 monthly
    • New gamers from United Kingdom spent an average of $16.52 monthly

    Most Played Mobile Games

    Genshin Impact Mobile Gaming Demographics

    For this part we will cover different statistics that determine how popular a mobile game is within the industry.

    • Data from March 2021 shows Genshin Impact only took 6 months before they reached $1 billion in player spending worldwide, making them the fastest mobile gaming app to reach $1 billion. They’re followed by Pokemon Go and Lineage M with 9 and 10 months respectively (27).
    • In the USA, Candy Crush Saga has the highest share of in-game or in app purchases in the United States with 11%, followed by Call of Duty: Mobile (28).
    • For the Gacha mobile gaming segment, the top grossing mobile game is Genshin Impact, generating $567 million during Q1 of 2022, followed by Lineage W and Uma Musume Pretty Derby with $272 million and $236 million respectively.

    Monetization for Mobile Gaming is Constantly Improving

    The mobile games market in North America was estimated at $27.7 billion. The F2P Mobile games market generated $13.2 billion in revenues for the first half of 2022 (8). The F2P’s business model focused heavily on low entry barrier with enhanced in-game features and unlockable content available for purchase. People play mobile games for free may still be motivated to further their gaming experience by purchasing these DLCs, in-game currency, or other features. To prove this statement, the average mobile gamer in the USA spent $61.2 every year on mobile games in 2021. Majority (38%) of the mobile gaming population in North America spent $30 to $99 annually (29).

    (1) https://www.statista.com/statistics/292751/mobile-gaming-revenue-worldwide-device/

    (2) https://www.statista.com/statistics/455655/digital-game-revenue-category-digital-market-outlook-usa/

    (3) https://www.statista.com/statistics/455601/digital-game-users-category-digital-market-outlook-usa/

    (4) https://www.statista.com/statistics/260167/mobile-gaming-share-of-total-gaming-revenue-worldwide/

    (5) https://www.statista.com/statistics/511639/global-mobile-game-app-revenue/

    (6) https://www.statista.com/statistics/240993/share-of-f2p-mmo-spending-by-region/

    (7) https://www.statista.com/statistics/1272175/quarterly-us-app-consumer-spending-by-category/

    (8) https://www.statista.com/statistics/292507/mobile-contents-market-value-north-america/

    (9) https://www.statista.com/statistics/256673/global-mobile-game-revenue-by-region/

    (10) https://www.statista.com/statistics/512112/number-mobile-gamers-world-by-region/

    (11) https://www.statista.com/outlook/dmo/digital-media/video-games/mobile-games/united-states

    (12) https://www.statista.com/forecasts/1301032/mobile-gaming-revenue-asia

    (13) https://www.statista.com/statistics/1179913/highest-grossing-mobile-games/

    (14) https://www.statista.com/statistics/1079038/pubg-mobile-spending/

    (15) https://www.statista.com/statistics/512112/number-mobile-gamers-world-by-region/

    (16) https://www.statista.com/statistics/1319411/mobile-gaming-time-week-country/

    (17) https://www.statista.com/statistics/1243409/us-mobile-gaming-users-gender/

    (18) https://www.statista.com/forecasts/1303534/southeast-asia-number-of-mobile-gamers-segment-revenue-by-country-and-gender

    (19) https://www.statista.com/statistics/269126/mobile-gamers-in-the-uk-by-age-and-gender/

    (20) https://www.statista.com/statistics/1077362/south-korea-mobile-gamer-distribution-by-gender/

    (21) https://www.statista.com/statistics/272327/mobile-social-and-traditional-gaming-users-by-gender/

    (22) https://www.statista.com/statistics/748089/number-mobile-gamers-world-platform/

    (23) https://www.statista.com/statistics/1272891/worldwide-game-apps-time-spent-daily-age/

    (24) https://techcrunch.com/2019/08/22/mobile-gaming-mints-money/

    (25) https://www.statista.com/statistics/1220107/new-and-existing-mobile-gamer-monthly-spend/

    (26) https://www.statista.com/statistics/1107246/kids-in-app-purchases-spending/

    (27) https://www.statista.com/statistics/1227011/fastest-mobile-games-reach-1-billion-player-spending-worldwide/

    (28) https://www.statista.com/statistics/202866/in-game-purchases-mobile-game-titles-usa/

    (29) https://www.statista.com/statistics/1200153/amount-spent-video-games-spending-spenders/

    (30) https://www.statista.com/statistics/1308503/gacha-game-mobile-gross/